


Chart depicting the U.S. real GDP quarter-over-quarter percent annualized (right-hand side) and the S&P Global U.S. composite PMI (left-hand side) from 2014 through February 20, 2026. The latest figures are 3.1% and 52.3%, respectively.
In each issue of Owner to Owner, we review aspects of the business environment on three fronts:
- Overall economy
- Credit markets
- Private equity (PE) and mergers and acquisitions (M&A) markets
The following article examines the state of the economy at the start of 2026, marked by growth amid continued policy uncertainty and high consumer delinquency rates, a pause in the rate-cutting cycle and tightening credit spreads, and renewed momentum in the PE and M&A markets.
The economy
According to the initial estimate by the U.S. Bureau of Economic Analysis (BEA), U.S. real gross domestic product (GDP) expanded at a quarter-over-quarter annualized rate of 1.4% in fourth quarter 2025, well below the 2.8% consensus estimate. This marks a sharp deceleration from the 4.4% real GDP growth recorded in third quarter 2025, reflecting downturns in government spending and exports and a deceleration in consumer spending that were partly offset by an acceleration in investment. There was considerable noise in this fourth quarter GDP growth estimate, as the U.S. government was shut down for almost half of the three-month period. The BEA estimates the reduction in federal services subtracted roughly 1% from GDP growth, suggesting GDP growth should have been roughly 2.4%. The personal consumption expenditure (PCE) component of GDP – which drives 70% of GDP over the long run – advanced 2.4%, driven entirely by spending on services, as spending on capital goods was negative.
Despite the below-consensus fourth quarter 2025 GDP growth rate, as of March 2, 2026, the Atlanta Fed GDPNow Index forecasts first quarter 2026 GDP growth to rebound to 3.0%. Macro data, such as the S&P Global U.S. Composite PMI Index, suggests the economy is expected to remain in expansion territory, which sets a positive backdrop for companies’ earnings growth. The S&P 500 is estimated to generate earnings per share (EPS) growth of 14.5% in 2026 and 16.0% in 2027, up from an estimated 12.7% in 2025.
Macro data ... suggests the economy is expected to remain in expansion territory, which sets a positive backdrop for companies’ earnings growth.”
Shifting to the U.S. labor market, the U.S. economy added 130,000 jobs in January 2026, pushing the average three-month nonfarm payrolls net change into positive territory and its highest level since February 2025. As such, the U.S. unemployment rate (U-3 rate) declined to 4.3% in January 2026, down from 4.4% recorded in December 2025. Significant declines in the U-3 rate may prove to be challenging, as the number of job openings declined to 6.5 million, the lowest level in over five years and roughly 14% below the pre-COVID-19 peak set in November 2018.
Meanwhile, consumer delinquencies across auto loans, credit cards, and student loans have reached multiyear highs, and are at levels not seen since the 2008 global financial crisis (GFC). This raises concerns about the health of household balance sheets. Particularly striking is the sharp increase in student loan delinquencies as the grace period preventing negative credit reporting for missed payments expired in September 2024. Consequently, consumer confidence as measured by the Conference Board Consumer Confidence Index remains 20% below the four-year peak achieved in November 2024.

Chart depicting a sharp increase in consumer delinquency metrics across student loans, auto loans, and credit card delinquencies. The latest figures are 16.2%, 12.7%, and 3.0%, respectively.
As it relates to monetary policy, in January 2026 the Federal Open Market Committee (FOMC) paused its interest rate-cutting cycle after reducing rates for three consecutive meetings from September 2025 to December 2025. Fed Chairman Jerome Powell stated that economic growth continues to surprise to the upside, noting real U.S. GDP grew at an annualized rate of 4.4% in third quarter 2025. With Powell’s term as chair ending in May, President Trump announced Kevin Warsh as his nominee to succeed Powell. Despite Warsh being labeled an “inflation hawk” during his tenure as Fed governor from 2006 to 2011, the fed funds futures curve continues to price in two rate cuts by year-end 2026, particularly as “supercore”1 inflation reached multiyear lows in January 2026.
There is much underway as we progress throughout 2026 – a new Fed chair, monetary policy, President Trump’s tariff policy following the U.S. Supreme Court’s International Emergency Economic Powers Act (IEEPA) tariff ruling, the impact to inflation following the U.S./Israel attack on Iran, and the impact of artificial intelligence (AI) on economic growth, to name just a few – and we will be watching inflation and global growth developments closely.
The credit market
The FOMC’s 25-basis point (bp)2 rate cut in December 2025 continued an easing cycle that resulted in a total of 75 bps of cuts during 2025 and 175 bps since the cycle began in September 2024, for a total of seven cuts. The latest cut brings the fed funds target rate range to between 3.50% and 3.75%, a three-year low. Chairman Powell noted it is “within a broad range of estimates of its neutral value” and that the Fed is “well positioned to wait to see how the economy evolves.” The neutral value is the rate that keeps the economy at full employment while maintaining stable inflation around the Fed’s 2% target.
After “driving through the fog” heading into the December Fed meeting, the delayed release of U.S. labor market data in October and November due to the government shutdown from October 1, 2025, to November 12, 2025, sent conflicting signals. Job growth remained resilient even as participation and hiring momentum softened, and the data was further distorted by deferred resignations of government employees from earlier in the year.
The absence of new economic data led the FOMC chair to promote a slowdown ahead of the December meeting to assess the impacts of a cooling labor market combined with persistent inflation. However, as tariff pressures appeared less likely to cause significant slowdowns in economic growth, the FOMC’s December Economic Projections revised its 2026 real GDP growth forecast up from 1.8% in September to 2.3%, while lowering the Personal Consumption Expenditures (PCE) inflation forecast from 2.6% to 2.4%. These factors suggest this rate-cutting cycle is more reflective of a normalization of monetary policy rather than an accommodative easing.
[T]his rate-cutting cycle is more reflective of a normalization of monetary policy rather than an accommodative easing.”
The nearby dot plot from the December 2025 meeting showed that most FOMC members (12 of 19) expect at least one more 25-bp interest rate cut in 2026, with the median forecast suggesting a range of 3.25% to 3.50% by the end of 2026. One additional cut of 25 bps is expected in 2027 to a range of 3.0% to 3.25%, while the spread of dots (individual projections) was largely unchanged from September to the December meeting. Although a wide dispersion of views remains, the dot plot signals a slow, data-dependent path for rate cuts in 2026, with the majority expecting a modest reduction, but with internal disagreement on the pace and extent of easing.

Dot plot from the December 2025 Fed meeting showing that 12 of 19 FOMC members expect at least one more 25-bp interest rate cut in 2026, with the median forecast suggesting a range of 3.25% to 3.50% by the end of 2026.
At its January 2026 meeting, along with the decision to pause rate cuts, the FOMC left the fed funds rate unchanged at 3.50% to 3.75%. The pause was expected by markets, and officials characterized economic activity as healthier and expanding at a solid pace, vs. prior moderate descriptions. Despite lower job gains, the labor market was described as having stabilized with low unemployment, while inflation remains somewhat elevated, prompting a cautious approach to future rate adjustments. As discussed, as of February 2026, fed funds futures, in particular the CME FedWatch Tool, suggest the market anticipates around one to two 25-bp rate cuts in 2026. This estimate is broadly consistent with the FOMC’s December dot plot projections, with potential easing beginning around June and near year-end 2026.3
A recent speech in January 2026 by Fed Vice Chair for Supervision Michelle Bowman reinforced these themes of conditionality and lack of clear consensus. She emphasized that the FOMC’s latest cuts were intended to “proactively limit the risks of greater and more persistent damage to the labor market, while inflation continued to show signs that it is on a sustained downward trajectory toward the 2% objective.” Future monetary policy will not follow a predetermined course, and decisions will continue to be made on meeting-by-meeting basis – an evolving outlook for future cuts determined by incoming economic data.
Additionally, growing political pressure on the Fed (e.g., the Department of Justice’s criminal investigation into Chair Powell) could sway the interest rate outlook, which hinges on the Fed’s ability to maintain its independence. Warsh, the nominee to succeed Powell as Fed chair, is broadly expected to advocate for lower rates, having echoed Trump’s calls for lower rates and defending tariffs in recent months on television interviews. It remains unclear whether Powell will stay on as Fed governor for his remaining two-year term after his chair term expires in May 2026. Although Fed chairs cannot dictate policy decisions, which require building consensus with the FOMC, the impacts of Fed independence on monetary policy will be important to monitor looking forward.
History suggests that monetary policy and the Fed’s overnight lending policy rates have a meaningful influence on the yield curve for shorter maturities of approximately two years or less, while medium- and longer-term yields are more heavily influenced by market expectations of economic growth, business cycles, inflation, and other risk premiums. The nearby chart of U.S. Treasury yield curves across various maturities illustrates this phenomenon.
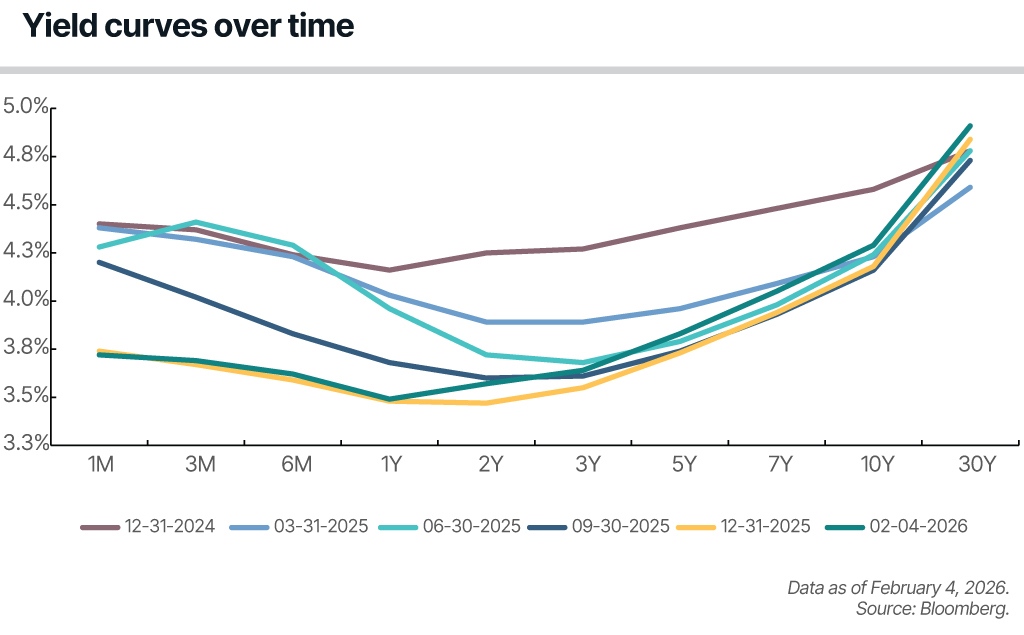
Chart depicting the U.S. Treasury yield curves across one-, three-, and six-month maturities; and one-, two-, three-, five-, seven-, 10-, and 30-year maturities as of February 4, 2026.
With the Fed’s control of the overnight lending window, shorter-term yields declined through December 31, 2025, following the September, October, and December meetings. Although FOMC commentary from the January 2026 meeting suggested a longer pause in the easing cycle, by early February 2026 short-term yields were minimally changed as markets adjusted to a higher-for-longer neutral rate expectation.
By contrast, longer-term yields traded within a relatively narrow range (generally oscillating within a 40- to 60-bp range) over the past 13 months as investor sentiment fluctuated. Since first quarter 2025, the yield curve has steadily steepened, with the difference between two- and 10-year yields reaching its steepest level (72 bps) since early 2022 and possibly reflecting the market’s outlook on stable or improving economic conditions and rising inflation.
Likewise, investors remain optimistic about the macroeconomic outlook on corporate prospects. Corporate bond prices continue to rise, and as shown in the nearby chart, spread compression occurred across investment grade to junk bonds throughout 2025, with corporate spreads entering 2026 at their narrowest levels in the past five years.

Chart depicting corporate spreads by quality from 2005 through 2026. As of February 4, 2026, spreads for bonds rated high yield, BBB, and A stood at 2.4%, 1.0%, and 0.7%, respectively.
As of February 4, 2026, spreads for bonds rated high yield, BBB, and A stood at 2.4%, 1.0%, and 0.7%, respectively. On a year-over-year basis, spread compression was concentrated entirely in high yield, which tightened from 2.9% at the same time last year, while BBB and A spreads were unchanged. For context, the current spread compression compares similarly to the pre-Great Recession lows (2005 to 2006) of 2.3%, 1.2%, and 0.7%, respectively.
In mild contrast with these positive movements in the credit markets and narrowing corporate spreads, U.S. banks remain cautious, but had become less so during the second half of 2025, regarding the overall impact of tariffs and tax cuts on U.S. businesses and consumers. The nearby chart shows the historical trend in commercial and industrial (C&I) loans outstanding, along with the net percentage of U.S. banks that have adjusted credit standards for loans to large and middle-market firms, according to the Fed’s Senior Loan Officer Opinion Survey (SLOOS) on Bank Lending Practices.

Chart depicting the amount of C&I loans vs. bank standards from 2000 through 2025. The latest figures are $2,710 and 5.3%, respectively.
As with the previous four quarterly reports, the January 2026 SLOOS indicated that a majority of banks (net 5.3%) reported tighter standards during the quarter, citing economic uncertainty; industry-specific challenges; and legislation, regulation, and accounting changes. The combination of strict standards and reduced tolerance for risk correlates with most respondents reporting weaker demand across all borrower types. However, the net share reporting tighter standards has fallen modestly for the past three quarters from a net 18.5% in April 2025. In January 2026, survey respondents reported tighter lending standards for C&I loans to firms of all sizes, yet demand strengthened: In each of the past two quarters, a moderate net share of banks reported stronger demand from large and middle-market firms and an increase from potential borrowers regarding the availability and terms of new or increased credit lines.
Banks continuing caution, albeit easing, suggest a lending market that remains selective. Although private credit has played an important role in filling the gaps left by traditional banks through providing loans with more flexible structures at higher costs to riskier borrowers, cracks in this opaque market began to show with the public bankruptcies of First Brands and Tricolor during 2025. High-profile restructurings and bankruptcies across consumer-facing sectors such as retail and distribution have continued into early 2026, with the recent bankruptcies of Saks Fifth Avenue and Eddie Bauer highlighting the vulnerability of highly leveraged capital structures amid slowing demand and higher financing costs. These episodes underscore growing investor scrutiny around underwriting discipline, covenant protections, and sponsor behavior within the private credit ecosystem.
At BBH, our focus remains on deploying capital thoughtfully to resilient businesses and helping our clients navigate an evolving economic landscape. We believe patient, relationship-driven lending is well-positioned to deliver durable outcomes over generations of market cycles for both BBH and our clients.
The private equity and mergers and acquisitions markets
The U.S. PE sector experienced a challenging start in 2025, despite initial optimism fueled by improving market sentiment, post-election clarity, and the anticipation of business-friendly policies. Unpredictable tariff announcements led to significant market volatility in activity during the second quarter. General partners (GPs) waited for clearer signals regarding macroeconomic risks, financing conditions, and valuation issues before proceeding. Fortunately, this period of caution subsided by third quarter 2025. Lower interest rates, greater market clarity, and the availability of over $1 trillion in dry powder in the U.S. alone contributed to a favorable environment for dealmaking as the year progressed. Exit activity, which had been subdued in recent years due to firms holding assets for longer amid valuation uncertainty, saw a significant recovery in 2025. Fundraising continues to be the weakest area for PE, a significant year-over-year decline.4
As we enter 2026, the industry’s resilience, combined with a willingness to learn and innovate, will be crucial in navigating future challenges and opportunities. PE’s perseverance in 2025 underscores its enduring relevance and potential for long-term value creation.5
PE is being rapidly transformed by integrating technology throughout the investment process to address increasing demands from investors and stakeholders. Firms are actively assessing how AI can be utilized in fund and portfolio company management. AI applications are being incorporated throughout the investment lifecycle, including AI-driven deal sourcing, enhanced due diligence, portfolio monitoring, and standardized reporting. Looking ahead to 2026, many firms are expected to further develop their AI capabilities, embedding them into fund and portfolio management strategies. Adopting such approaches will position AI as a key competitive advantage within the increasingly complex PE landscape.6 E&Y’s most recent Private Equity Pulse survey reveals that 53% of PE firms plan to increase their hiring of digital transformation specialists compared to previous years, and 51% are looking to bring on more data scientists and AI professionals.7
Over the course of 2025, PE invested in an estimated 9,019 deals with an aggregate value approaching $1.2 trillion. The data indicates a shift toward larger transactions, as evidenced by the renewed prominence of megadeals. This trend was supported by improved market conditions, enabling sponsors to once again pursue a wide variety of deals across the PE landscape. Following a brief slowdown in second quarter 2025, which coincided with the announcement of global tariffs, deal activity rebounded strongly in the second half of the year, with 4,560 deals completed with a combined value of $632.2 billion. This resurgence helped push second half activity to levels not observed in recent years.8 The financing environment is easing, as the average cost of funding for PE middle-market term loans has dropped 3 percentage points from its peak, with potential for further decline in 2026 if Fed rates are cut. Lower interest rates typically improve PE internal rates of return, and this trend is expected to continue.9

| U.S. Private Equity Activity Deal Flow by Year | ||
| Year | Deal value ($B) | Deal count |
| 2015 | $551.8 | 4,676 |
| 2016 | $468.9 | 4,823 |
| 2017 | $591.1 | 5,374 |
| 2018 | $658.7 | 6,265 |
| 2019 | $689.9 | 6,557 |
| 2020 | $631.4 | 6,620 |
| 2021 | $1,268.7 | 10,315 |
| 2022 | $953.3 | 9,446 |
| 2023 | $733.2 | 8,153 |
| 2024 | $847.8 | 8,519 |
| 2025 | $1,155.5 | 9,019 |
PE exit activity has moved past the challenges of recent years with a rebound that ranks second only to the record-breaking levels of 2021. In 2025, an estimated 1,619 exits were completed, totaling $728.1 billion. This marks an improvement of 90.1% in exit value and a 17% increase in exit count compared with the previous year. In fourth quarter 2025, approximately 429 exits occurred, amounting to $229.2 billion in aggregate value. While this represented a 7.7% quarter-over-quarter decline in exit count, exit value surged by 98.5%. The impressive jump in exit value was primarily driven by a handful of exceptionally large exits, resulting in the highest quarterly exit value since second quarter 2021.
The outlook for PE exits appears optimistic. According to PitchBook’s inaugural U.S. Private Equity Survey, 61% of respondents foresee better exit conditions in the next six months, and half of those surveyed identified portfolio company exits as a key near-term priority.10 In 2026, fund managers are expected to apply previous lessons amid higher capital costs and increased macro risks. With less room for error than in 2021, they will focus on rigorous valuations, pursue fewer but higher-quality deals, and incorporate flexible exit strategies from the outset, whether through sales, IPOs, or alternative structures like secondary processes.11

| U.S. Private Equity Exits by Year | ||
| Year | Exit value ($B) | Exit count |
| 2015 | $355.6 | 1,343 |
| 2016 | $327.4 | 1,282 |
| 2017 | $364.7 | 1,358 |
| 2018 | $397.1 | 1,460 |
| 2019 | $306.2 | 1,347 |
| 2020 | $456.0 | 1,252 |
| 2021 | $844.2 | 1,947 |
| 2022 | $311.3 | 1,456 |
| 2023 | $284.1 | 1,328 |
| 2024 | $383.0 | 1,384 |
| 2025 | $728.1 | 1,619 |
In 2025, PE fundraising registered its weakest performance since 2020. During the year, PE firms closed 327 funds, collectively raising $277.9 billion. This represents a significant decline from the previous year's fund count and aggregate value. While exit activity continued to grow throughout 2025, it did not reach a level that would dramatically expand fundraising efforts. According to PitchBook’s 2026 U.S. Private Equity Outlook, the fundraising environment is expected to remain highly concentrated as the 10 largest funds are projected to account for at least 40% of total capital raised in the U.S. If the strong trend in exit activity seen in 2025 persists into 2026, this consolidation among top funds could potentially subside. Despite an increase in exits during 2025, the volume remained insufficient to make up for the limited exit activity from 2022 to 2024, when many sponsors postponed bringing portfolio companies to market, leading to several years of reduced distributions to LPs, and thus less capital available for new fund commitments.
At the end of first quarter 2025, dry powder had rebounded (after a dip in 2024) to nearly $1.1 trillion, marking the highest level of uncalled capital ever recorded for the asset class.12 While fundraising is slow and challenging, factors for recovery are in place, and an increase is expected by early 2026.13 While many PE funds seek more capital than LPs can provide, LP interest remains solid, and there is growing recognition among LPs that now is a good time to invest with adaptable GPs.14

| U.S. Private Equity Fundraising by Year | ||
| Year | Capital raised ($B) | Fund count |
| 2015 | $137.9 | 401 |
| 2016 | $189.2 | 427 |
| 2017 | $250.9 | 510 |
| 2018 | $194.9 | 454 |
| 2019 | $350.1 | 538 |
| 2020 | $256.5 | 537 |
| 2021 | $382.4 | 831 |
| 2022 | $390.1 | 1,089 |
| 2023 | $408.0 | 1,033 |
| 2024 | $381.6 | 668 |
| 2025 | $277.9 | 327 |
In third quarter 2025, North American M&A activity gained momentum after a flat second quarter, with deal count increasing by 5% quarter over quarter and deal value rising by 23%, including estimates for late reporting and nondisclosed deals. With 5,066 announced or completed deals totaling $762.2 billion, the deal value of third quarter 2025 set a new quarterly record, surpassing the previous high of $723.1 billion in fourth quarter 2021, achieved during a year of frenzied M&A activity. Quarterly deal count is also the highest it has been since second quarter 2022.
Although macroeconomic uncertainty caused by changing tariff announcements, low consumer and business confidence, and still-high interest rates led to some hesitation among investors in the second quarter, markets recovered by the third quarter and bounced back strongly with more deals at larger sizes. The interest rate cut by the Fed in September also supports the risk-on stance investors are increasingly returning to and is likely to boost the revival of dealmaking activity through the end of the year.15

| North American M&A Activity | ||
| Year | Deal value ($B) | Deal count |
| 2015 | $2,185.8 | 15,164 |
| 2016 | $1,997.4 | 14,051 |
| 2017 | $1,670.4 | 14,656 |
| 2018 | $2,087.8 | 15,939 |
| 2019 | $1,970.2 | 15,805 |
| 2020 | $1,599.1 | 15,305 |
| 2021 | $2,734.6 | 21,692 |
| 2022 | $1,955.8 | 19,767 |
| 2023 | $1,802.5 | 17,334 |
| 2024 | $2,025.7 | 17,495 |
| 2025* | $2,008.8 | 11,634 |
Conclusion
As 2026 gets underway, the business environment remains shaped by policy uncertainty and evolving credit conditions. The Fed’s recent rate-cutting pause signals a more cautious path, while narrow credit spreads and continued growth in private credit point to sustained investor confidence. Against this backdrop, the PE and M&A markets have regained momentum, underscoring renewed optimism despite the still-mixed macroeconomic environment.
If you have any questions about navigating today’s business environment, reach out to your BBH relationship manager.


1Supercore measures core CPI services ex. housing inflation
2One basis point (bp) is equal to 1/100th of 1%, or 0.01%.
3Such tools provide only an indication about the extent to which markets are pricing in future monetary policy changes, and implied probabilities do not have strong predictive power over longer-term horizons.
4PitchBook.
5E&Y PE Trends 2026.
6BDO 2026 PE Predictions.
7E&Y PE Trends 2026.
8PitchBook.
9Morgan Stanley PE 2026 Outlook.
10PitchBook.
11BDO 2026 PE Predictions.
12PitchBook.
13Paul, Weiss.
14Ibid.
15PitchBook.
Brown Brothers Harriman & Co. (“BBH”) may be used to reference the company as a whole and/or its various subsidiaries generally. This material and any products or services may be issued or provided in multiple jurisdictions by duly authorized and regulated subsidiaries. This material is for general information and reference purposes only and does not constitute legal, tax or investment advice and is not intended as an offer to sell, or a solicitation to buy securities, services or investment products. Any reference to tax matters is not intended to be used, and may not be used, for purposes of avoiding penalties under the U.S. Internal Revenue Code, or other applicable tax regimes, or for promotion, marketing or recommendation to third parties. All information has been obtained from sources believed to be reliable, but accuracy is not guaranteed, and reliance should not be placed on the information presented. This material may not be reproduced, copied or transmitted, or any of the content disclosed to third parties, without the permission of BBH. All trademarks and service marks included are the property of BBH or their respective owners. © Brown Brothers Harriman & Co. 2026. All rights reserved. PB-09326-2026-02-18