
Telecom |
-40% |
Cons. Disc |
-37% |
Technology |
-28% |
Real Estate |
-26% |
S&P 500 |
-18% |
Materials |
-12% |
Financials |
-11% |
Industrials |
-6% |
Health Care |
-2% |
Cons. Stap. |
-1% |
Utilities |
2% |
Energy |
66% |
Overview
| Investment Returns as of Dec 31, 2022 | |||||
|---|---|---|---|---|---|
| Asset Class | 3 Months | 1 Year | 3 Years* | 5 Years* | 10 Years* |
| Fixed Income | |||||
| 1-3 Year Treasury Bonds | 0.7% | -3.8% | -0.5% | 0.7% | 0.7% |
| U.S. Aggregate Bonds | 1.9% | -13.0% | -2.7% | 0.0% | 1.1% |
| Global Aggregate Bonds (USD - unhedged) | 4.5% | -16.2% | -4.5% | -1.7% | -0.4% |
| U.S. Municipal Bonds | 4.1% | -8.5% | -0.8% | 1.3% | 2.1% |
| U.S. High Yield Bonds | 4.2% | -11.2% | 0.0% | 2.3% | 4.0% |
| U.S. Leveraged Loans | 2.7% | -0.6% | 2.5% | 3.3% | 3.7% |
| U.S. Inflation-Linked Bonds | 2.0% | -11.8% | 1.2% | 2.1% | 1.1% |
| Equity | |||||
| Global Equity (USD) | 9.9% | -18.0% | 4.5% | 5.8% | 8.6% |
| U.S. Large Cap Equity | 7.6% | -18.1% | 7.7% | 9.4% | 12.6% |
| U.S. Small Cap Equity | 6.2% | -20.5% | 3.1% | 4.1% | 9.0% |
| Nasdaq Composite | -0.8% | -32.5% | 6.2% | 9.7% | 14.5% |
| Non-U.S. Developed Equity (USD) | 17.3% | -14.5% | 0.9% | 1.5% | 4.7% |
| Emerging Markets Equity (USD) | 9.7% | -20.1% | -2.7% | -1.4% | 1.4% |
| Non-U.S. Developed Equity (Local) | 8.7% | -7.0% | 3.6% | 3.8% | 7.6% |
| Emerging Markets Equity (Local) | 6.6% | -15.5% | 0.1% | 1.3% | 4.6% |
| REITs | 4.1% | -24.9% | 0.2% | 4.4% | 7.1% |
| Commodities/Other | |||||
| Gold | 9.8% | 0.5% | 6.3% | 7.0% | 0.9% |
| Silver | 25.9% | 4.0% | 10.3% | 7.2% | -2.3% |
| Crude Oil | 1.0% | 4.2% | 9.5% | 5.8% | -1.3% |
| Bitcoin | -14.7% | -64.9% | 32.3% | 3.0% | 103.7% |
| Alerian MLP | 10.1% | 30.9% | 9.4% | 4.1% | 2.0% |
| * Annualized return figures Past returns do not guarantee future results Source: Bloomberg |
|||||
2022 was a difficult year in the markets. There were very few places to hide, and for the first time since the inception of the Bloomberg U.S. Agg Index (1976), both fixed income and equities declined together, making this the worst performance year since 2008 for a 60/40 portfolio with a return of -16.1%. Many factors negatively impacted market returns. Inflation reached its highest level in 40 years and the Federal Reserve, late to recognizing that inflation in fact was not transitory, finally capitulated and raised rates aggressively, resulting in the fastest rate increase in the past 40 years. A surprise attack by Russia on Ukraine in February 2022 led to an energy crisis in Europe and commodity price increases with WTI Crude oil reaching highs of $122/barrel. Additionally, concerns about China and its zero Covid policy had far reaching impacts on supply chains and global growth.
Our portfolios were not immune to these developments, and in 2022, they generated negative absolute returns. While we are never happy with unrealized losses, we think that the true measure of risk is permanent loss of capital, so we believe that price declines simply provide us with opportunities to buy high-quality securities at better prices. We continue to remain steadfast in our belief that our portfolios will recover and deliver on our objective of providing our clients with strong long-term results. During difficult market periods, we did what experience has taught us – maintained our resolve, stayed calm, and doubled our research and monitoring efforts. Our efforts included:
- Re-underwriting our managers and their portfolios: We spent significant amounts of time with our managers to ensure that the fundamentals of their investments remained sound and that they were taking advantage of opportunities, where available, to add to existing positions or initiate new positions at increasingly attractive prices. We reviewed each manager’s trading decisions, research models, and quarterly letters, among other resources, to gain confidence that their processes were consistent with our initial underwriting. We utilized various quantitative metrics, including returns analysis, statistical ratios, internal rate of return trackers and look through tools to confirm the results of our qualitative analyses. We were also focused on the stability of our managers’ organizations. Were the managers continuing to have positive net flows? Were the portfolio managers adding to their own investments? Were the teams stable? How were they spending their time?
- Adding complementary strategies: We met with over 250 managers during the year and added several new strategies to our platform that we believed would benefit from the macro developments in the markets. For example, we closed on two investments that provided floating rate loan exposure. We also added several new public equity managers, including a dividend growth strategy that seeks to provide a growing stream of dividend income.
- Policy portfolio changes: We adapted as markets provided opportunities. One such example is in fixed income. We entered 2022 with a short duration fixed income posture, which helped our portfolios outperform in an extremely difficult bond market. As rates increased and the yields on offer became more attractive, our fixed income teams began opportunistically buying longer duration bonds. Within equities, we maintained our below target weight, which proved to be helpful in 2022. We are not yet adding aggressively to equities until we see some stability in inflation and clarity in the Federal Reserve’s position as we believe there could be additional volatility and downside pressure in 2023.
- Tax loss harvesting and fee negotiations: We worked closely with our managers to harvest losses for our taxable clients creating valuable tax assets. We also took the opportunity to negotiate fees with our managers and were able to reduce management fees in several instances.
In difficult times, it is often tempting to abandon course and follow what is working in the short-term. We did not fall prey to that temptation, although, as always, we did make changes to our portfolios in response to changing market conditions. Nevertheless, within public equity we remain committed to staying invested with high quality concentrated active managers, which we believe will be rewarded in the coming years as the dispersion among the returns of the best and worst companies grows.
As we enter 2023, we are watching earnings carefully, and while we can’t rule out a recession, we do think that based on the strength of the labor market and the consumer, we would anticipate a mild one, should it occur. Importantly, recessions do not mean that returns will be negative. In fact, in nine of the 12 past recessions since 1948, the equity markets were higher a year later. We can’t predict returns over short periods. However, we do know that all our managers are very excited about the forward-looking returns of their portfolios, which bodes well for long term investors. As always, we thank you for your continued support!
2022 In Review
During the year, the S&P 500 finished down 18.1%. The index troughed at -25.4% in October at a level of 3577, and is currently at 3973.1 Interestingly, there were five days that drove the majority of the decline. They were:
Past performance does not guarantee future results.
If an investor had been out of the market for those five days, the return of the S&P 500 Index would have been only -0.2%, a significantly better result. But alas, such market timing is impossible, and so we don’t attempt to employ such a strategy.
In the U.S., the Nasdaq Index, which is comprised of technology and other fast-growing companies, was particularly hard hit, declining 32.5% in 2022. In a year of extraordinary rate increases, market participants increased the discount rates that they were using to value these stocks, and therefore, reassessed the intrinsic values downward. However, as is known to happen in periods of uncertainty, stocks were sold indiscriminately, as the markets did not differentiate between high quality profitable companies, whose valuations could be justified by their growing earnings, and those with poor unit economics that would never be profitable, whose valuations depended on the continuation of cheap money. This dynamic, while painful, created opportunities for our active managers.
Turning to sector returns, we see that there was quite a bit of dispersion during the year. The chart below shows the sector returns for the S&P 500 Index. As noted earlier, energy was the best performing sector, returning 66%. At BBH we focus on quality, which we define as companies with: (1) high returns on equity, (2) long runways for growth and improving profitability, and (3) solid balance sheets with low financial leverage. As a result, our equity portfolios were underweight energy, as our managers believed that the cyclical companies that were getting rewarded by the markets were not as attractive on a long-term basis as the quality names that they owned. Unfortunately, as markets declined in 2022, quality names were punished; in fact, the MSCI USA Quality Index returned -23% versus the S&P 500 Index of -18%. However, in every 5-, 10-, 15-, 20-, and 25-year period ending December 31, 2022, quality outperformed the S&P 500 index. We continue to believe that this historical return pattern will persist over time, and that ultimately price will follow value, resulting in strong long-term returns.

Past performance does not guarantee future results.
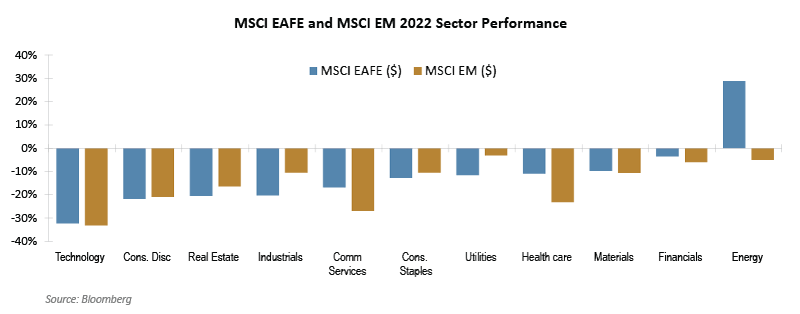
Outside of the U.S., international developed outperformed the U.S. for the first time since 2017, returning -14.5%, while Emerging Markets returned -20.1%, underperforming the S&P 500 for the fifth consecutive year. Within the EAFE Index, Japan was the largest detractor, and within Emerging Markets Equity, China was the worst performer. Our portfolios were under-weight both countries. On a sector basis, as see in the chart below, there was a similar story to the U.S. in that energy was the best performer. However, technology (not communication services as in the U.S.) generated the weakest return during the year.
Past performance does not guarantee future results.
| MSCI EAFE ($) | MSCI EM ($) | |
| Technology | -32.3% | -33.1% |
| Cons. Disc | -21.8% | -20.9% |
| Real Estate | -20.5% | -16.4% |
| Industrials | -20.2% | -10.4% |
| Comm Services | -16.8% | -26.9% |
| Cons. Staples | -12.7% | -10.5% |
| Utilities | -11.6% | -3.1% |
| Health care | -11.0% | -23.2% |
| Materials | -9.8% | -10.6% |
| Financials | -3.5% | -6.0% |
| Energy | 28.8% | -5.0% |
The strengthening dollar was a headwind to the EAFE and Emerging Markets Indices. In local currency terms, the MSCI EAFE and MSCI Emerging Market outperformed the S&P 500 by 11.1% and 2.6%, respectively. Many foreign currencies are currently attractively valued against the dollar, and any reversion to the mean would be a positive for U.S. investors in international equities.
Fixed income
In 2022, the fixed income markets went through a huge resetting of interest rates as the Federal Reserve embarked on its fastest interest rate hiking cycle in the last 40 years. Coming into the year, the fed funds target range was still near the pandemic-era low of close to 0%, but as inflation accelerated to levels not seen in over 40 years, the Federal Reserve raised rates during 7 of 8 Federal Open Market Committee (FOMC) meetings to end the year with a fed funds target range of 4.25-4.50%, the highest since late 2007. These rate moves resulted in elevated levels of volatility in the U.S. Treasury market. With starting yields low, and the rate of change of Fed tightening so fast, nearly every segment of the fixed income market experienced declines. For context, the Bloomberg U.S. Agg Index, which is a broad-based benchmark that measures the investment grade, fixed-rate taxable bond market, declined 13% for the year, its worst annual decline since its inception in 1976.
At BBH, our fixed income portfolios have been overweight short duration bonds for several years, as this has been a period of historically low yields. As rates began to rise, we extended duration in our portfolios opportunistically. However, we continue to believe that being patient in fixed income, as opposed to reaching for yield, will pay off. While it is impossible to know what will happen in 2023, we will stand ready to take advantage of opportunities when and if interest rates and or credit spreads provide them.
Private Investments
In 2022, our private investments performed well, during a challenging market environment for public and private investments. We held a diversified portfolio of private equity, direct lending, distressed debt, and real estate. We also added several new private investments that had floating rate loan exposure – one in reinsurance and the other in real estate lending, which should benefit from rising rates. We have a full pipeline of attractive opportunities and will continue to add compelling strategies.
Looking Ahead – 2023 and Beyond
Although we are fundamental bottom-up investors, it is our practice each year to develop capital market estimates for major asset classes. While we do not rely on these estimates for making investment decisions, we do utilize them to help frame expectations for returns and assist in wealth planning conversations. Notably, these estimates are based on index returns and do not include estimates of manager alpha.
For 2022, our 20-year capital market estimates are as follows2
| 2023 Capital Market Expectation: 20-Year Time Horizon as of November 30, 2022 | |
|---|---|
Asset Class |
Pre-Tax Expectations Geometric Return (CAGR) |
Fixed Income |
|
Short Duration Bond Funds |
3.4% |
U.S. Investment Grade Taxable Bonds |
4.3% |
U.S. Investment Grade Tax-Exempt Bonds |
2.9% |
Non-Investment Grade Debt |
5.9% |
Private Debt |
7.0% |
Equity |
|
U.S. Large-Cap Equity |
6.7% |
U.S. Small-Cap Equity |
7.7% |
Non-U.S. Developed Equity |
8.2% |
Emerging Markets Equity |
8.7% |
Private Equity / Distressed |
11.7%/10.7% |
Real Assets |
|
Private Real Estate |
7.0% |
| There is no assurance the return expectations will be achieved. | |
As we think about positioning our portfolios for 2023, we are focused on several opportunities. We continue to look for attractive active public equity managers that are complementary to our existing strategies, and in early 2023, we will add a new international equity manager and a U.S. mid-cap strategy to our portfolio line-up. We understand that inflation is the biggest long-term threat to portfolios, and our positioning in high quality equities with pricing power as well as real estate funds should provide protection over long periods. In fixed income, we continue to be short duration, but we extended duration in the latter half of the year, taking advantage of higher rates, and we will continue to do so opportunistically. In an environment like we had last year where fixed income and equity correlations became positive, we recognize the need to increase the allocation to diversifying strategies, those that will be uncorrelated to the equity markets. One particularly attractive opportunity is in distressed debt, as many good companies will undergo stress with leverage levels that are unsustainable in the increased rate environment. As always, we will continue to utilize bottom-up, fundamental research to make investments that will preserve and grow our clients’ capital successfully over time. Please reach out to your relationship manager if you have any questions.

1 1/20/23
2 Definitions Yield: A measure of cash flow received from an investment over a given period expressed as a percentage of the investment’s value. For fixed income, the cash flow is composed of interest income; for equities, the cash flow is made up of dividend payments. Geometric return (CAGR): The compound annual growth rate (CAGR) is a geometric return that represents the single rate of return that an investment would have achieved by growing from its beginning balance to its ending balance assuming all cash flows were reinvested at the end of each year. Standard deviation: Measures the historical volatility of returns. The higher the standard deviation, the greater the volatility.
DISCLOSURES
Risks
Investors should be able to withstand short-term fluctuations in the equity markets and fixed income markets in return for potentially higher returns over the long term. The value of portfolios changes every day and can be affected by changes in interest rates, general market conditions and other political, social and economic developments.
S&P 500 Total Return – The S&P 500 Index is an unmanaged, weighted index of 500 stocks providing a broad indicator of price movements. The index is not available for direct investment.
Opinions, forecasts, and discussions about investment strategies are as of the date of this commentary and are subject to change without notice. References to specific securities, asset classes, and financial markets are for illustrative purposes only and are not intended to be and should not be interpreted as recommendations.
Brown Brothers Harriman & Co. (“BBH”) may be used as a generic term to reference the company as a whole and/or its various subsidiaries generally. This material and any products or services may be issued or provided in multiple jurisdictions by duly authorized and regulated subsidiaries. This material is for general information and reference purposes only and does not constitute legal, tax or investment advice and is not intended as an offer to sell, or a solicitation to buy securities, services or investment products. Any reference to tax matters is not intended to be used, and may not be used, for purposes of avoiding penalties under the U.S. Internal Revenue Code, or other applicable tax regimes, or for promotion, marketing or recommendation to third parties. All information has been obtained from sources believed to be reliable, but accuracy is not guaranteed, and reliance should not be placed on the information presented. This material may not be reproduced, copied or transmitted, or any of the content disclosed to third parties, without the permission of BBH. All trademarks and service marks included are the property of BBH or their respective owners. © Brown Brothers Harriman & Co. 2023. All rights reserved.
Any contact information you provide to us is maintained in our database. More information about our privacy policy including our CCPA statement can be found on bbh.com using the following link: https://www.bbh.com/en-us/our-firm/policies-and-disclosures/privacy-policy
Investment Advisory Products and Services:
NOT FDIC INSURED NO BANK GUARANTEE MAY LOSE VALUE
PB-06060-2023-01-23 Expires 12/31/2024