

Table depicting two-, five-, 10-, and 30-year real yields and breakevens’ levels and quarter-to-date change in basis points. Real yields around short and intermediate maturities fell in the first quarter, while longer real yields rose and breakevens increased.
Highlights
|
Old tensions, new shocks
First quarter 2026 confirmed gravity cannot be ignored for too long. Policy uncertainty, above-target inflation, and institutional friction, deferred throughout 2025, did not dissipate. Instead, they were joined by a new shock: The U.S. and Israeli military strikes on Iran on February 28, 2026, sent crude oil prices above $100 per barrel for the first time since 2022, adding new inflationary pressures at a moment when the labor market has shown further weakness. The combination of moderate employment alongside inflationary risks complicates the Federal Reserve’s (Fed) job of balancing maximum employment and price stability. Against this backdrop, Treasury Inflation-Protected Securities (TIPS) provide real income and direct protection against inflation risk that geopolitical shocks tend to produce.
Market update
Real yields around short and intermediate maturities fell in the first quarter, with the move amplified by the energy shock in March. Longer real yields rose in the quarter, steepening the real yield curve. The 10-year real yield finished the quarter at 2.01%, up 11 basis points (bps)1 from year-end 2025. Market-implied inflation expectations, or breakevens, increased, especially near short tenors, reflecting higher and more volatile energy prices. Five-year breakevens reached 2.6% by quarter end. The move around short maturity breakevens indicates investors expect higher inflation over the next few years, and a return to more stable prices thereafter (see Exhibit I).

TIPS returned +0.26% in first quarter 2026, outperforming nominal Treasuries by +30 bps. Net flows into TIPS-related exchange-traded funds remained positive, reaching approximately $4.8 billion over the quarter.
Performance and positioning
The portfolio returned +0.45% in the first quarter, driven by the steepening of the real yield curve and roll-down return. Compared with the Bloomberg U.S. Treasury Inflation-Linked Bond Index, the benchmark, our TIPS portfolios outperformed by +20bps. In March, our duration overweight detracted from performance as real yields rose, but our curve positioning partially offset the impact of rising real rates.
Our universe of investable securities is comprised of TIPS maturing in less than one year, combined with dozens of securities in the benchmark. In Exhibit II(a), our expected returns framework illustrates roll-down opportunities in the intermediate part of the real yield curve.
Throughout the quarter, our term structure allocation stayed relatively unaltered. Exhibit II(b) illustrates this positioning. Duration is concentrated in the three- to 10-year maturity range, while the short and long ends are underweight duration. Overall, the portfolio had a slight duration overweight. As we enter the new quarter, the active duration and term structure remain almost unchanged.

Chart depicting the expected returns framework, which illustrates roll-down opportunities in the intermediate part of the yield curve as well as where we are positioned.

Table depicting the portfolio’s term structure vs. the benchmark. Throughout the quarter, the term structure allocation stayed relatively unaltered.
Macroeconomic conditions and policy
The U.S. economy entered 2026 with near-trend growth expectations around 2.5% and the prospects of further investment in sectors related to artificial intelligence (AI) and fiscal stimulus. The labor market remains the weakest link, which continued to show moderation in the first quarter. The conflict in the Middle East has exacerbated the risk of a scenario in which employment and growth disappoint while inflation remains elevated.
Nonfarm payrolls rose 205,000 in the first quarter (see Exhibit III), with January and March surprising on the upside and February contracting due to a healthcare strike, adverse weather, and continued federal workforce reductions. Considering that the full-year job creation for 2025 was 116,000 — an average of under 10,000 per month, the quarter stands out, but it made almost no impact on the 12-month moving average. The unemployment rate edged down to 4.3% in March, but as the decline in labor force participation suggests, this is more about unemployed workers leaving the labor force than finding new jobs. Going forward, strict immigration policies could exacerbate labor market shortages, adding to inflationary pressures.

Chart depicting the monthly change and the 12-month moving average in the labor market from January 1, 2024, through March 1, 2026. Nonfarm payrolls rose 205,000 in first quarter 2026.
Headline inflation, measured by the Consumer Price Index (CPI) moved to 3.3% in March — its highest reading since May 2024. The jump in energy prices contributed 0.8%. Core CPI moved to 2.6%, with the long-awaited deceleration in shelter costs making a substantial contribution. The rent component posted its smallest monthly increase since January 2021 in February (see Exhibit IV). Although inflation has come down from the post-COVID-19 surge, it remains above the Fed’s 2% target and faces renewed upward pressures.
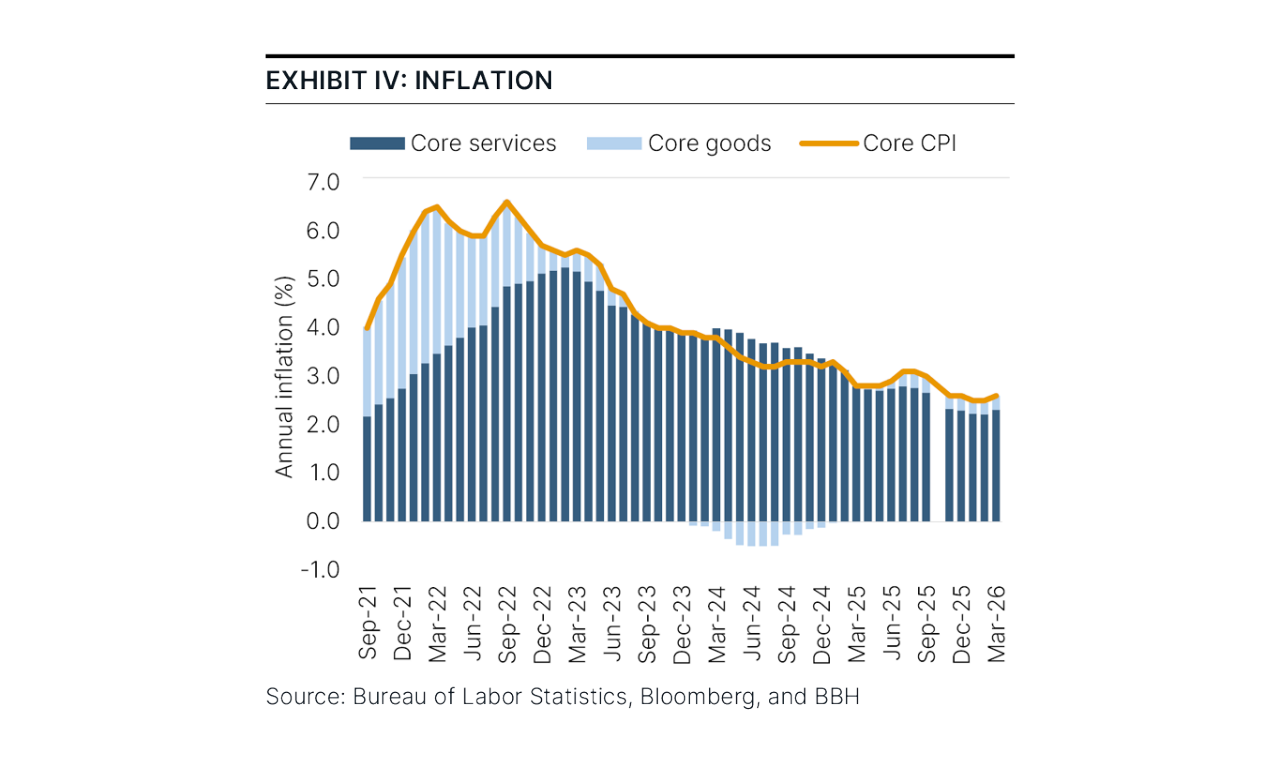
Chart depicting inflation across core services, core goods, and core Consumer Price Index (CPI). Headline inflation, measured by the Consumer Price Index (CPI) moved to 2.4% in January – its lowest reading since May 2025 – and held there in February.
The Fed held the policy rate range steady at 3.50% to 3.75% at both Federal Open Market Committee (FOMC) meetings. At the March meeting, only Governor Stephen Miran dissented in favor of easing, a marked change from December’s three-dissent split, as the Iran conflict and its inflationary implications appeared to keep potential doves on the sidelines. Fed officials expect just one 25-bp cut in 2026, unchanged from December, though the distribution of views is dispersed: Seven officials see no cuts this year, seven see one cut, and five anticipate two or more.
Kevin Warsh was nominated to replace Jerome Powell as the next Chair of the Federal Reserve Board when his term ends in May. While Warsh has aligned himself with the administration’s preference for lower rates, his prior tenure on the Fed Board was associated with a hawkish stance. This has generated some uncertainty about the durability of his stated dovishness. We expect the leadership transition to dominate monetary policy discourse in the second quarter, even as the economic data, particularly on inflation, will determine the path of interest rates. Fed independence and institutional credibility remain central concerns for 2026.
Conclusion
Inflation risk arrived in first quarter 2026. Underlying inflation had been decelerating, core services cooling, and the shelter component normalizing. A geopolitical shock erased some of that progress in a matter of days. Shocks are unpredictable, but TIPS provide protection precisely against unanticipated inflation.
As we enter the second quarter, the resolution of the Iran conflict and the pace of the Fed leadership transition will dominate market dynamics. Real yields are attractive, with the 10-year real yield around 2.0%. At these levels TIPS collect real income as they protect investors from inflation. TIPS remain the most disciplined asset class to navigate a world with increased inflation uncertainty.
Contact Us

| Performance As of March 31, 2026 | |||||||
|---|---|---|---|---|---|---|---|
| Total Returns | Average Annual Total Returns | ||||||
| Composite/Benchmark | 3 Mo. | YTD | 1 Yr. | 3 Yr. | 5 Yr. | 10 Yr. | Since Inception |
| BBH Inflation-Indexed Securities Composite - gross of fees | 0.45% | 0.45% | 3.09% | 3.14% | 1.46% | 2.68% | 5.02% |
| BBH Inflation-Indexed Securities Composite - net of fees | 0.41% | 0.41% | 2.93% | 2.99% | 1.31% | 2.52% | 4.86% |
| Bloomberg U.S. TIPS Index | 0.26% | 0.26% | 3.00% | 3.18% | 1.48% | 2.66% | 4.70% |
| Returns of less than one year are not annualized. The Inflation-Indexed Fixed Income Composite inception date is 04/01/1997. | |||||||
| Past performance does not guarantee future results. Source: BBH & Co. and Bloomberg | |||||||
``
1 One basis point is equal to 0.01%.
RISKS
The value of the portfolio can be affected by changes in interest rates, general market conditions and other political, social and economic developments. Each investor should evaluate their ability to invest for the long-term, especially during periods of downturn in the market.
Investing in the bond market is subject to certain risks including market, interest-rate, issuer, credit, maturity, call and inflation risk; investments may be worth more or less than the original cost when redeemed. Bond prices are sensitive to changes in interest rates and a rise in interest rates can cause a decline in their prices.
Foreign investing involves special risks including currency risk, increased volatility, political risks, and differences in auditing and other financial standards.
The Strategy may also invest in derivative instruments, investments whose values depend on the performance of the underlying security, assets, interest rate, index or currency and entail potentially higher volatility and risk of loss compared to traditional bond investments.
Holdings are subject to change. Totals may not sum due to rounding.
The Bloomberg U.S. TIPS Index includes all publicly issued, U.S. Treasury inflation-protected securities that have at least one year remaining to maturity, are rated investment grade, and have $250 million or more of outstanding face value. The index is not available for direct investment.
“Bloomberg®” and the Bloomberg indexes are service marks of Bloomberg Finance L.P. and its affiliates, including Bloomberg Index Services Limited (“BISL”), the administrator of the indexes (collectively, “Bloomberg”) and have been licensed for use for certain purposes by Brown Brothers Harriman & Co (BBH). Bloomberg is not affiliated with BBH, and Bloomberg does not approve, endorse, review, or recommend the BBH Strategy. Bloomberg does not guarantee the timeliness, accurateness, or completeness of any data or information relating to the strategy.
Effective duration is a measure of the portfolio’s return sensitivity to changes in interest rates.
Credits: Obligations such as bonds, notes, loans, leases and other forms of indebtedness, except for Cash and Cash Equivalents, issued by obligors other than the U.S. Government and its agencies, totaled at the level of the ultimate obligor or guarantor of the Obligation.
One basis point or bp is 1/100th of a percent (0.01% or 0.0001).
Holdings and attribution information is of a single representative account (“Representative Account”) that invests in the strategy. It is managed with the same investment objectives and employs substantially the same investment philosophy and processes as the Inflation-Indexed Fixed Income Strategy.
Brown Brothers Harriman Investment Management (“IM”), a division of Brown Brothers Harriman & Co (“BBH”), claims compliance with the Global Investment Performance Standards (GIPS®). GIPS® is a registered trademark of CFA Institute. CFA Institute does not endorse or promote this organization, nor does it warrant the accuracy or quality of the content contained herein.
To receive additional information regarding IM, including a GIPS Composite Report for the strategy, contact John W. Ackler at 212 493-8247 or via email at john.ackler@bbh.com.
Gross of fee performance results for this composite do not reflect the deduction of investment advisory fees. Net of fees performance results reflect the deduction of the maximum investment advisory fees. Returns include all dividends and interest, other income, realized and unrealized gain, are net of all brokerage commissions, execution costs, and without provision for federal or state income taxes. Results will vary among client accounts. Performance calculated in U.S. dollars.
The objective of our Inflation-Indexed Fixed Income Strategy is to deliver excellent returns in excess of industry benchmarks through market cycles. The Composite included all fully discretionary, fee-paying domestic accounts over $10 million with an emphasis on U.S. inflation indexed securities. May invest up to approximately 25% outside of U.S. inflation indexed securities, and a duration of approximately 7-9 years. Accounts that subsequently fall below $9.25 million are excluded from the Composite.
There is no assurance the investment objectives will be achieved.
Brown Brothers Harriman & Co. (“BBH”) may be used to reference the company as a whole and/or its various subsidiaries generally. This material and any products or services may be issued or provided in multiple jurisdictions by duly authorized and regulated subsidiaries. This material is for general information and reference purposes only and does not constitute legal, tax or investment advice and is not intended as an offer to sell, or a solicitation to buy securities, services or investment products. Any reference s tax matters is not intended to be used, and may not be used, for purposes of avoiding penalties under the U.S. Internal Revenue Code, or other applicable tax regimes, or for promotion, marketing or recommendation to third parties. All information has been obtained from sources believed to be reliable, but accuracy is not guaranteed, and reliance should not be placed on the information presented. This material may not be reproduced, copied or transmitted, or any of the content disclosed to third parties, without the permission of BBH. All trademarks and service marks included are the property of BBH or their respective owners. © Brown Brothers Harriman & Co. 2026. All rights reserved.
NOT FDIC INSURED NO BANK GUARANTEE MAY LOSE VALUE
IM-18320-2026-04-13 Exp. Date 07/31/2026