

Chart depicting economic policy uncertainty on a monthly average basis, where in
March 2025 uncertainty rose to levels not seen since early 2020 (the Covid-19 pandemic).
Highlights
|
Uncertainty
Implementing economic policy involves several steps. Policy makers must decide whether policy intervention is needed in the first place, the magnitude of the intervention, and potential ramifications across consumers, investors, and businesses. The objective in every step is to reduce policy uncertainty as much as possible. Uncertainty is like a tax with no revenue, worse than the policy itself. Since inauguration day, the Washington administration has made more than 20 on-again, off-again announcements on tariffs, driving policy uncertainty to levels not seen since the pandemic (Exhibit Ia). As a result, consumer sentiment, small business optimism and CEO confidence collapsed. (See Exhibit Ib.)
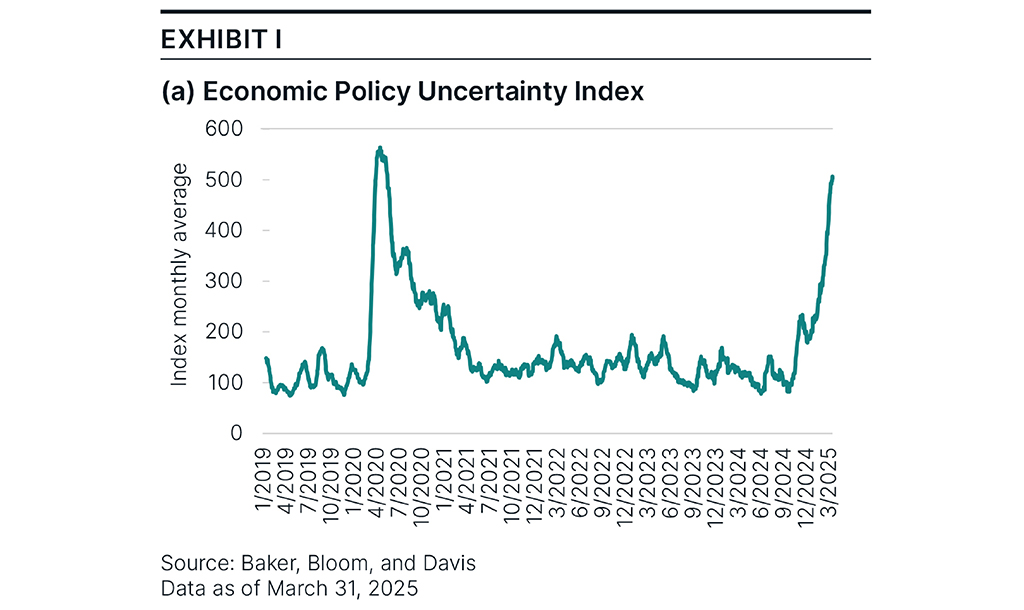
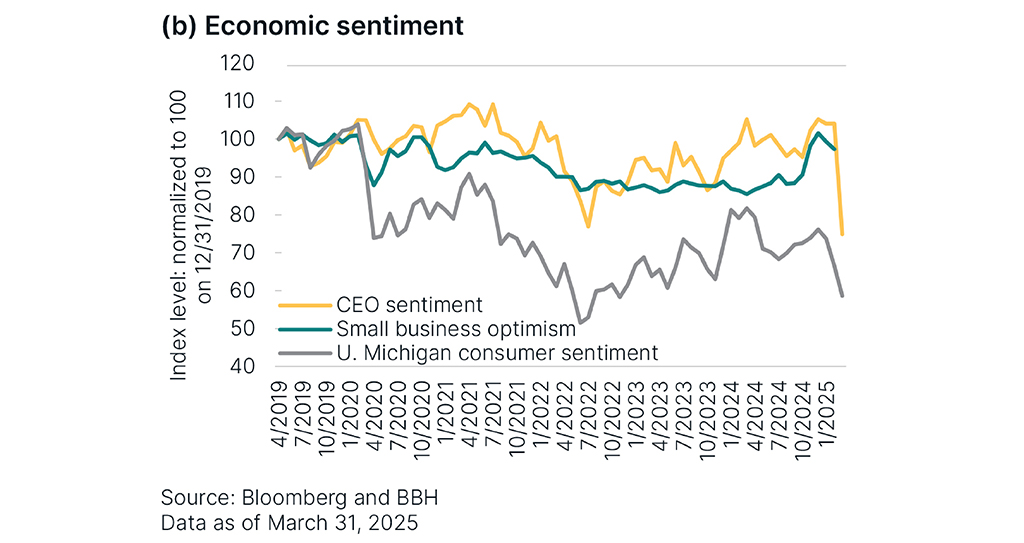
Chart tracking economic sentiment across three measures: CEO sentiment, small business optimism, and University of Michigan consumer sentiment. All three measures declined during first quarter 2025.
Most economists agree that tariffs and other barriers to international trade should be low or non-existent. Based on that premise, an efficient world economic order evolved over the last 70 years. One in which the U.S. and other advanced nations reduced trade barriers and specialized in services, while emerging markets specialized in manufacturing. This order cannot shift overnight, and not without massive disruptions. As an example, consider the auto industry. It is estimated that assembling a Ford F-150 requires approximately 30,000 parts, of which almost 15,000 are imported from Canada and Mexico. Perhaps the imported parts could be produced domestically, but it would take years to reconfigure existing supply chains and costs would increase. These disruptions make tariffs inherently unstable, and long-term commitment to them is uncertain.
Inflation market update
During first quarter 2025, the real yield curve steepened, with two-year and five-year yields falling 105 basis points (bps)1 and 67bps, while the 10-year rate fell 39bps. Market-implied inflation expectations (breakevens) below the 10-year tenor increased more than 20bps, while the 10-year breakeven rate remained almost unchanged. For the quarter, Treasury Inflation-Protected Securities (TIPS) returned +4.17%, outperforming nominal Treasuries by 1.25%, and corporate bonds by 1.8%. Net inflows into TIPS-related Exchange-Traded Funds reached $4.7 billion in first quarter 2025, the most since late 2021, when inflation was 7% and rising. Regarding monetary policy, fed fund futures imply three rate cuts, one more than at the beginning of the quarter.
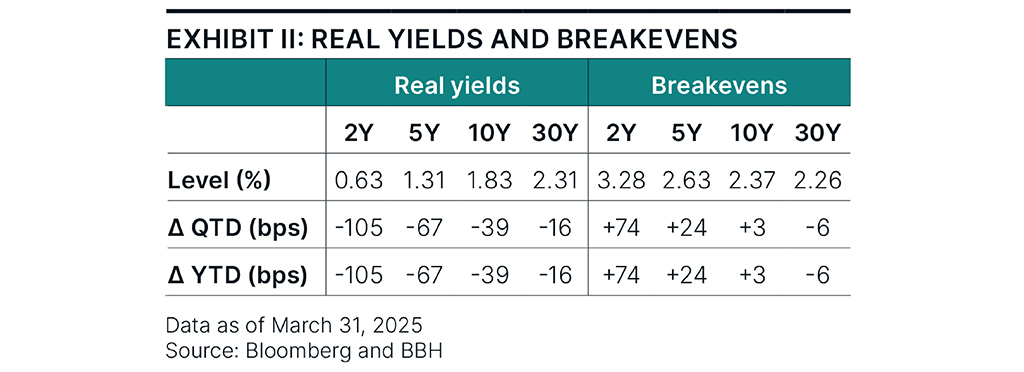
Chart depicting the quarter- and year-to-date change of two-, five-, 10-, and 30-year real yields and breakevens as of March 31, 2025, where breakevens rose during first quarter 2025.
Positioning and performance
The Bloomberg U.S. Treasury Inflation-Linked Bond Index holds several dozens of securities. We implement our active strategies with 10-15 – labeled as Holdings in Exhibit IIIa. During the quarter, we selected these securities to maximize roll-down opportunities, shifting market weight from short to intermediate maturities. As a result, we finished the quarter with a small duration overweight and a bias in favor of a real yield curve steepening. (See Exhibit IIIb.)
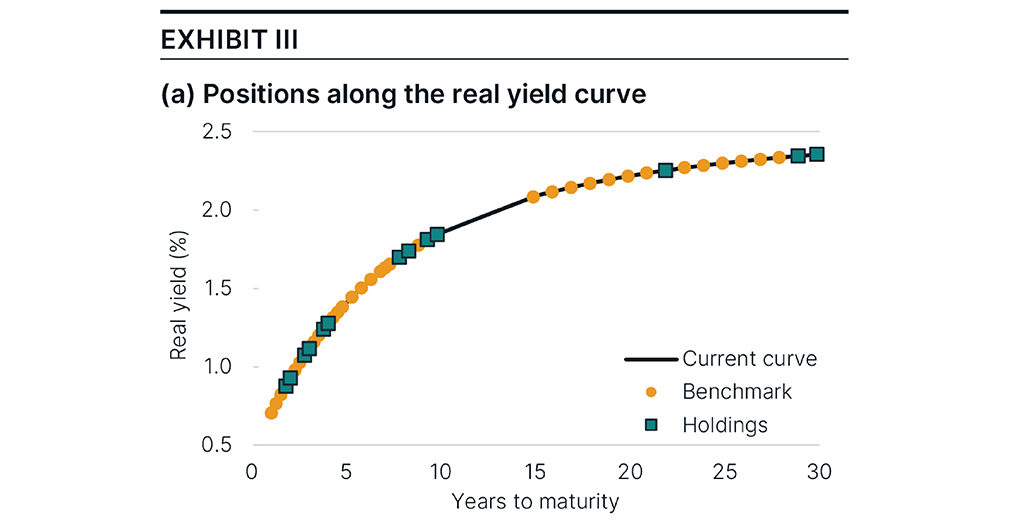
Chart depicting the portfolio positions along the real yield curve as of March 31, 2025. The portfolios finished the quarter with a bias in favor of a real yield curve steepening.
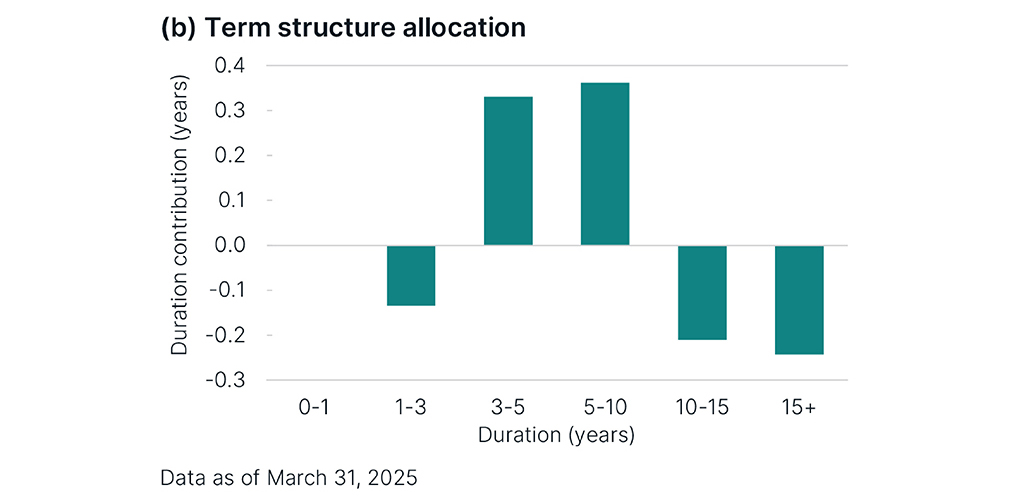
Chart depicting the portfolios’ term structure allocation as of March 31, 2025. The portfolios finished the quarter with a duration overweight of about one-tenth of a year.
Our TIPS portfolios outperformed their benchmarks by 12bps in first quarter 2025. Security selection, curve positioning, and duration contributed to performance. We participated in the 30-year TIPS auction in February, owning a 30-year nominal position as we prepared for the auction trade. This breakeven trade had a small positive impact on performance as well.
The economy and the Fed
Although measures of sentiment have deteriorated, economic data continues to reflect solid growth. High-frequency indicators suggest the economy grew around 2.5% in first quarter 2025 and the most recent labor market report showed the economy added 456,000 jobs in the quarter, an average pace of 152,000 per month, near the trailing 12-month average. Wage growth stabilized just above 4%, comfortably outpacing inflation. The headline unemployment rate finished the quarter at 4.2%.
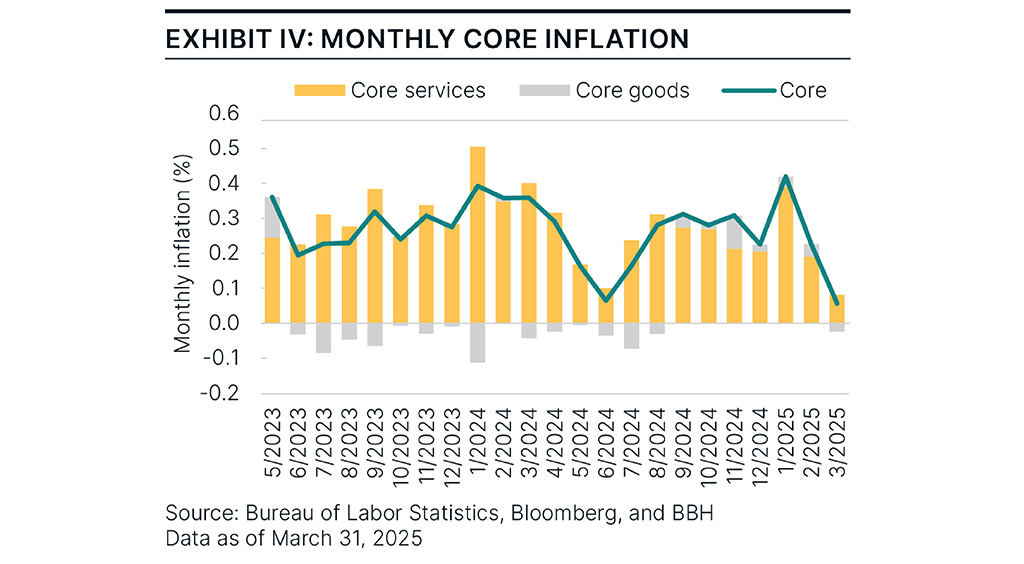
Chart depicting inflation as measured by the CPI. It finished the quarter at 2.8%, and annual core CPI inflation at 3.1%.
Inflation, measured by the annual change in headline Consumer Price Index (CPI), finished the quarter at 2.4%, and annual core CPI inflation at 2.8%. Services continue to drive core CPI. As shown in Exhibit IV, the housing complex, known as Shelter in CPI, represents more than 40% of core CPI and remains the main contributor. Monthly housing inflation has hovered around 0.3%, an annualized rate of about 3.7%, much higher than the pre-pandemic average of 2.5%. In March, inflation surprised on the downside led by sharp declines in airline fares and lodging-away-from-home components, leading supercore CPI, or services excluding housing, to deflate.
As expected, the Fed did not modify the policy rate in first quarter 2025. Reflecting the times, the March Federal Open Market Committee statement added the line: “Uncertainty around the economic outlook has increased.” In the March meeting, the Fed released the quarterly update to the Summary of Economic Projections (SEP). Compared to December’s SEP, the Fed projects an increase in core inflation from 2.5% to 2.8% and a reduction in economic growth from 2.1% to 1.4%.
The scope, levels, and shape of the future trade regime are still uncertain. Global trade will likely deteriorate, increasing the cost of intermediate and final goods. This environment complicates the conduct of monetary policy. We doubt the Fed would intervene to rescue volatile markets. The Fed is more likely to intervene if unemployment begins to rise.
Conclusion
Policy uncertainty has brought sentiment and optimism down, and if it persists, it may trigger a recession. The motivation behind the proposed trade policies is not clear either. The administration talked about revenue collection and the revitalization of U.S. manufacturing. The potential of tariffs to generate revenue depends on the new volume of imports and the retaliatory measures, and it is difficult to estimate. Employment in manufacturing has steadily declined from 40% of total employment in 1945, to 20% by 1980, and 8% by 2010. Trade explains part of the decline, but also productivity gains and technological progress. Domestic production of strategic items such as chips, semiconductors, and key intermediate goods is understandable to diversify supply chains. Perhaps it would be best to pursue this by working with our trading partners.
Using the present as a guide, future international trade will probably include higher tariffs than we have seen in modern times, resulting in higher prices and elevated uncertainty. The protection from unanticipated inflation that TIPS provide will not waver. TIPS returns remained robust in first quarter 2025, outperforming nominal Treasuries and corporate bonds in difficult times, solidifying the strength of the asset class in a wide range of market environments.
| Performance As of March 31, 2025 |
|||||||
|---|---|---|---|---|---|---|---|
|
Total Returns |
Average Annual Total Returns |
|||||
Composite/benchmark |
3 Mo. |
YTD |
1 Yr. |
3 Yr. |
5 Yr. |
10 Yr. | Since Inception |
BBH Inflation-Indexed Securities Composite - gross of fees |
4.29% |
4.29% |
6.30% |
-0.06% |
2.26% |
2.56% |
5.08% |
BBH Inflation-Indexed Securities Composite - net of fees |
4.25% |
4.25% |
6.15% |
-0.21% |
2.11% |
2.41% |
4.93% |
Bloomberg U.S. TIPS Index |
4.17% |
4.17% |
6.17% |
0.06% |
2.36% |
2.51% |
4.76% |
Returns of less than one year are not annualized. The Inflation-Indexed Fixed Income Composite inception date is 04/01/1997 Past performance does not guarantee future results. Sources: BBH & Co. and Bloomberg |
|||||||
Authors

1 Basis point (bp) is a unit that is equal to 1/100th of 1% and is used to denote the change in price or yield of a financial instrument.
RISKS
The value of the portfolio can be affected by changes in interest rates, general market conditions and other political, social and economic developments. Each investor should evaluate their ability to invest for the long-term, especially during periods of downturn in the market.
Investing in the bond market is subject to certain risks including market, interest-rate, issuer, credit, maturity, call and inflation risk; investments may be worth more or less than the original cost when redeemed. Bond prices are sensitive to changes in interest rates and a rise in interest rates can cause a decline in their prices.
Foreign investing involves special risks including currency risk, increased volatility, political risks, and differences in auditing and other financial standards.
The Strategy may also invest in derivative instruments, investments whose values depend on the performance of the underlying security, assets, interest rate, index or currency and entail potentially higher volatility and risk of loss compared to traditional bond investments.
Holdings are subject to change. Totals may not sum due to rounding.
The Bloomberg U.S. TIPS Index includes all publicly issued, U.S. Treasury inflation-protected securities that have at least one year remaining to maturity, are rated investment grade, and have $250 million or more of outstanding face value.
The index is not available for direct investment.
“Bloomberg®” and the Bloomberg indexes are service marks of Bloomberg Finance L.P. and its affiliates, including Bloomberg Index Services Limited (“BISL”), the administrator of the indexes (collectively, “Bloomberg”) and have been licensed for use for certain purposes by Brown Brothers Harriman & Co (BBH). Bloomberg is not affiliated with BBH, and Bloomberg does not approve, endorse, review, or recommend the BBH Strategy.
Effective duration is a measure of the portfolio’s return sensitivity to changes in interest rates.
Credits: Obligations such as bonds, notes, loans, leases and other forms of indebtedness, except for Cash and Cash Equivalents, issued by obligors other than the U.S. Government and its agencies, totaled at the level of the ultimate obligor or guarantor of the Obligation.
Holdings and attribution information is of a single representative account (“Representative Account”) that invests in the strategy. It is managed with the same investment objectives and employs substantially the same investment philosophy and processes as the Inflation-Indexed Fixed Income Strategy.
Brown Brothers Harriman Investment Management (“IM”), a division of Brown Brothers Harriman & Co (“BBH”), claims compliance with the Global Investment Performance Standards (GIPS®). GIPS® is a registered trademark of CFA Institute. CFA Institute does not endorse or promote this organization, nor does it warrant the accuracy or quality of the content contained herein.
To receive additional information regarding IM, including a GIPS Composite Report for the strategy, contact John W. Ackler at 212 493-8247 or via email at john.ackler@bbh.com.
Gross of fee performance results for this composite do not reflect the deduction of investment advisory fees. Net of fees performance results reflect the deduction of the maximum investment advisory fees. Returns include all dividends and interest, other income, realized and unrealized gain, are net of all brokerage commissions, execution costs, and without provision for federal or state income taxes. Results will vary among client accounts. Performance calculated in U.S. dollars.
The objective of our Inflation-Indexed Fixed Income Strategy is to deliver excellent returns in excess of industry benchmarks through market cycles. The Composite included all fully discretionary, fee-paying domestic accounts over $10 million with an emphasis on U.S. inflation indexed securities. May invest up to approximately 25% outside of U.S. inflation indexed securities, and a duration of approximately 7-9 years. Accounts that subsequently fall below $9.25 million are excluded from the Composite.
There is no assurance the investment objectives will be achieved.
Brown Brothers Harriman & Co. (“BBH”) may be used to reference the company as a whole and/or its various subsidiaries generally. This material and any products or services may be issued or provided in multiple jurisdictions by duly authorized and regulated subsidiaries. This material is for general information and reference purposes only and does not constitute legal, tax or investment advice and is not intended as an offer to sell, or a solicitation to buy securities, services or investment products. Any reference to tax matters is not intended to be used, and may not be used, for purposes of avoiding penalties under the U.S. Internal Revenue Code, or other applicable tax regimes, or for promotion, marketing or recommendation to third parties. All information has been obtained from sources believed to be reliable, but accuracy is not guaranteed, and reliance should not be placed on the information presented. This material may not be reproduced, copied or transmitted, or any of the content disclosed to third parties, without the permission of BBH. All trademarks and service marks included are the property of BBH or their respective owners. © Brown Brothers Harriman & Co. 2025. All rights reserved.
Not FDIC Insured No Bank Guarantee May Lose Money
IM-16439-2025-04-21 Exp. Date 07/31/2025