


Performance |
|||||||
|---|---|---|---|---|---|---|---|
|
Total Returns |
Average Annual Total Returns |
|||||
Composite/Benchmark |
3 Mo. |
YTD |
1 Yr. |
3 Yr. |
5 Yr. |
10 Yr. | Since Inception |
BBH Core Plus Fixed Income Composite (Gross of Fees) |
2.09% |
7.07% |
4.62% |
7.46% |
2.28% |
4.45% |
6.33% |
BBH Core Plus Fixed Income Composite (Net of Fees) |
2.03% |
6.87% |
4.36% |
7.19% |
2.03% |
4.19% |
6.06% |
Bloomberg US Aggregate Bond Index |
2.03% |
6.13% |
2.88% |
4.93% |
-0.45% |
1.84% |
5.55% |
Past performance does not guarantee future results. Strategy Inception: 01/01/1986 Returns of less than one year are not annualized. |
|||||||
The Bloomberg US Aggregate Bond Index is comprised of U.S. dollar-denominated investment grade fixed income securities with maturities of at least one year. The index includes corporate, government, and mortgage-backed securities. One cannot invest directly in an index. The composite of the index is materially different than the strategy’s holdings. Sources: Bloomberg and BBH & Co. |
|||||||
Highlights
|
Market Environment
U.S. fixed income markets posted solid returns during third quarter 2025 as interest rates declined across the curve, the Federal Reserve (the Fed) cut rates, and credit risk spreads narrowed further. All mainstream indexes had positive total returns and excess returns to credit.
Credit risk spreads were lower across all major indexes, and, for many indexes, quarter-end index spreads declined to levels last experienced in the late 1990s. The Bloomberg U.S. Corporate Index’s quarter-end spread hit its lowest month-end level since May 1998, while month-end spreads of double-B and single-B corporate bonds were lower at quarter-end only four times over the past 30 years. Structural changes to the composition of broad investment grade and high yield corporate bond indexes may provide reasons for these low spread levels. Looking forward from these spread levels, expected credit returns are meager and negative in many instances.
Unsurprisingly, the BBH Valuation Framework1 indicates a very low level of appropriately valued opportunities. The Framework showed that 3% of investment grade corporate bonds, 44% of corporate loans, 24% of high-yield corporate bonds, and no segment of the agency mortgage-backed securities (MBS) market met our criteria for purchase at quarter-end. Spreads of collateralized loan obligation (CLO) debt and many nontraditional asset-backed security (ABS) subsectors sit at the narrowest ends of their historic ranges. However, there remain opportunities in pockets of the credit markets. For example, there are opportunities for incremental yield in shorter maturity, high-grade corporate bonds. Debt of smaller issuers also screens favorably within the high yield bond and loan markets. Several nontraditional ABS subsectors screen attractively, and spreads of many commercial mortgage-backed security (CMBS) subsectors are at or above the medians of their historical ranges.
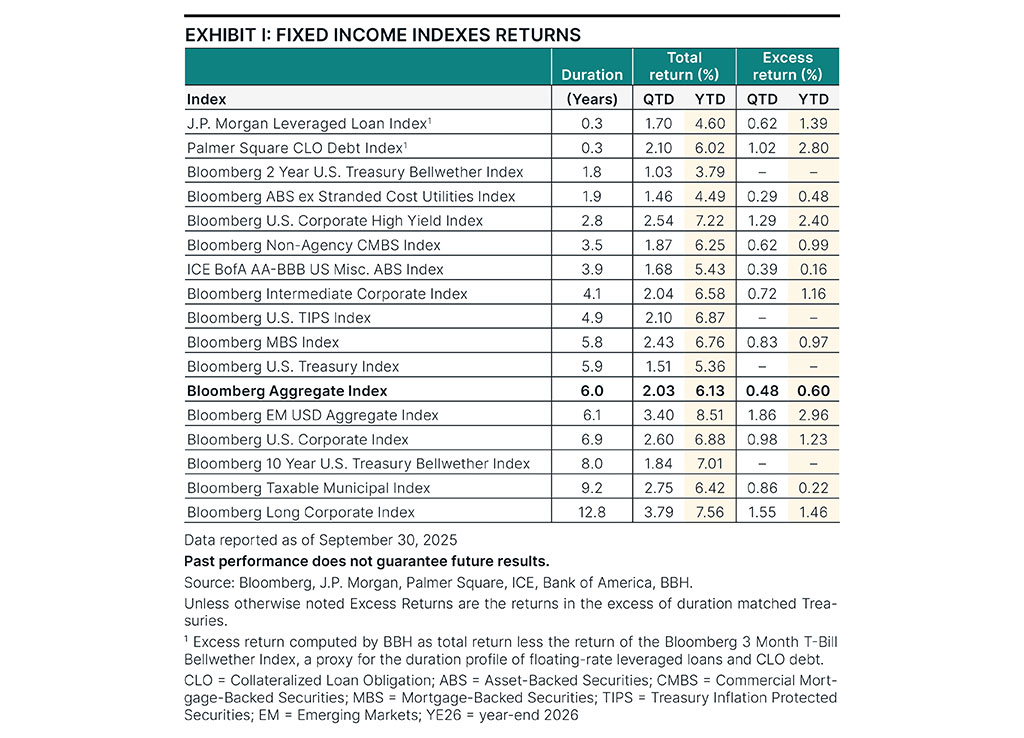
Exhibit I: Fixed income index returns for various indexes as of September 30, 2025, displaying duration, total return, and excess return.
Valuations
Both supply and demand for credit continue to be very strong. Credit issuance was strong vs. the subdued volumes from last quarter on account of lower interest rates and narrower credit risk spreads. Investment grade corporate bond issuance was in line with last year’s record-setting pace, while leveraged corporate debt issuance decreased 7% year over year. Leveraged corporate issuers increasingly chose bond issuance, where volumes were up 6% over last year vs. loans (down 11%). ABS volumes were down 2% from 2024’s pace for both traditional and nontraditional subsectors. Nonagency CMBS issuance was robust, with 40% more issuance than last year. Meanwhile, taxable bond fund flows are on pace to have one of the strongest calendar years on record. According to research from Barclays, new issues of investment grade corporate bonds have been approximately four times oversubscribed, with yields driven lower by 0.25% from their announcement to final pricing. Debt markets are open to issuers looking to refinance or raise new capital.
Generous refinancing availability tends to obscure cracks in credit quality; however, there are several trends that suggest the durability of issuers may be tested in the near future. Signs of stress are emerging for lower-income U.S. consumers. These consumers’ wages have not kept pace with the inflationary environment of 2022–2023, and high prices continue to impact spending choices. These inflationary dynamics will likely continue over the next 12 months. Prices of nonessential commodities such as coffee and chocolate have surged and are shifting consumers’ spending patterns towards staple goods. In addition, the price of federal healthcare programs is expected to increase by a median 18% in 2026 with the expiration of Affordable Care Act subsidies. Labor market conditions are a reason for concern, as wage growth has moderated and non-farm payrolls sit near their weakest levels in over 15 years (excluding the months following the onset of COVID-19). There are many loan credit performance indicators that suggest these trends are beginning to impact credit markets. Subprime auto loan default rates are near the higher end of their historical range. Delinquency rates of student loans are elevated after the U.S. government’s forbearance program ended, yet the resumption of student loan payments has not yet appeared to impact delinquency rates of other types of consumer loans.
Performance
The strategy outperformed its benchmark during the quarter with selection effects driving performance. Rate effects had minimal effect on results. Sector effects had a negative impact driven primarily by the strategy’s avoidance of agency MBS. Favorable selection effects were diversified among investment grade corporate bonds, loans, CMBS, and high yield corporate bonds. Positions in agency CMBS, technology loans, and investment grade corporate bonds of life insurance companies contributed to performance. Holdings of triple net lease ABS detracted modestly from selection effects.
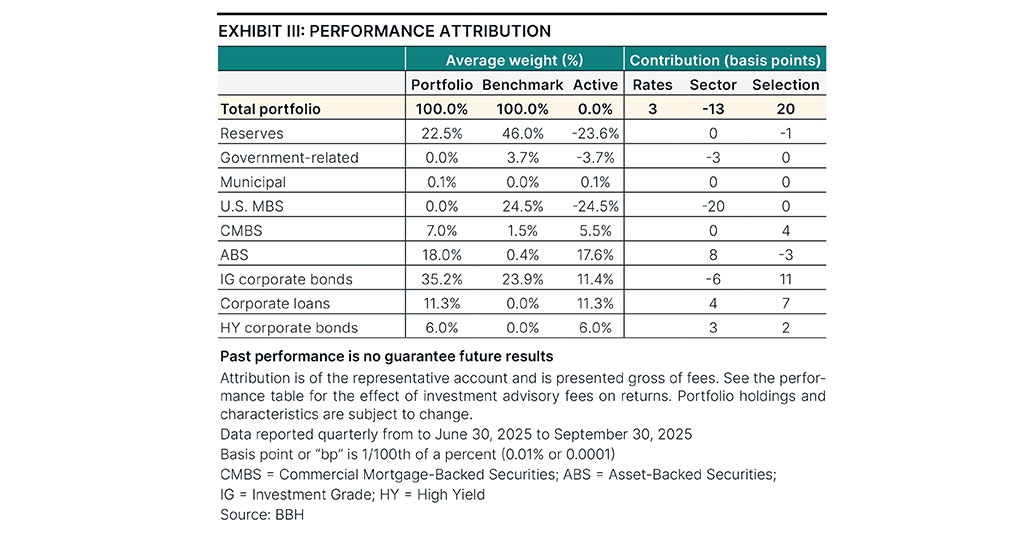
Exhibit III: Attribution as of September 30, 2025, showing average portfolio weight and gross contribution displayed in basis points.
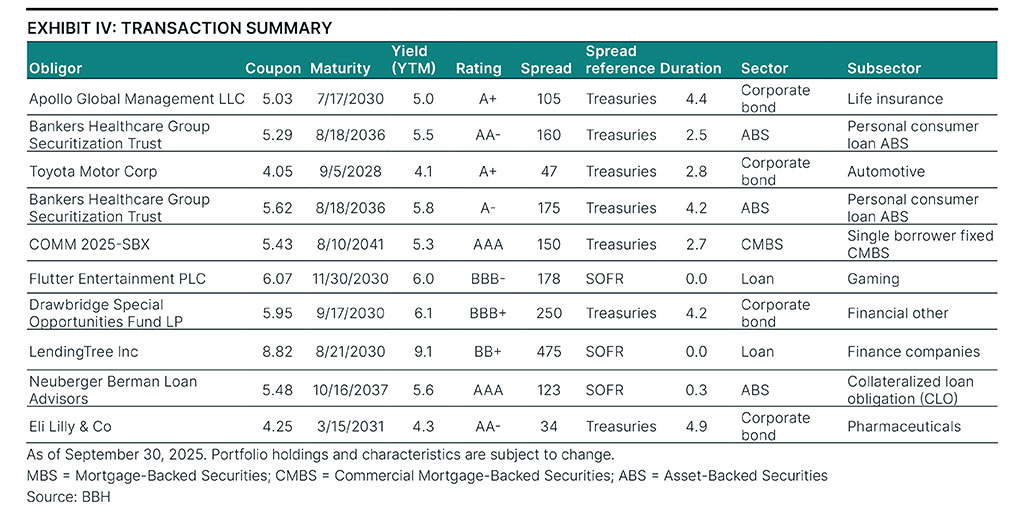
Transaction Summary
We continued to find durable credits2 offering attractive value even as valuations reflect a growing belief that the U.S. economy is slowing. The table below summarizes a few notable portfolio additions.
Characteristics
The portfolio’s spread duration decreased during the quarter and remained lower than the benchmark, reflecting less sensitivity to changes in credit spreads. Over the quarter, holdings of reserves increased while holdings of credit sectors decreased amid low-risk spreads. The portfolio held no exposure to agency MBS due to valuation concerns. The portfolio weight to high yield and nonrated credit instruments decreased to 15% from 18%.
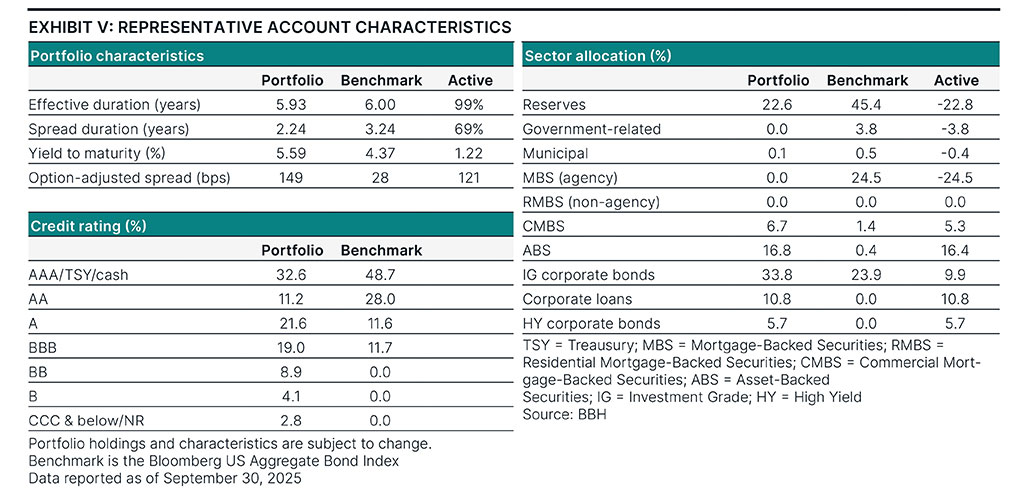
Exhibit V: Characteristics as of September 30, 2025, including credit rating and sector allocation.
Concluding Remarks
U.S. business conditions appear stronger. Default rates continue to moderate, delinquency rates and charge-offs of business loans remain subdued, and loan performance within CLOs and business development companies (BDCs) remains strong. There are significant infrastructure capital expenditures being made to support artificial intelligence (AI) ambitions, and they are being financed through the corporate and structured credit markets. With narrow spreads and many of these projects facing uncertain outcomes, strong credit research is paramount for navigating the increasing breadth of opportunities.
Strong credit research is always a necessary ingredient for attaining sustainable credit performance, and it is perhaps no surprise that our credit research identifies many issues that offer attractive yields but do not possess the durability features we seek. However, opportunities remain in every market. In environments of low-risk spreads and sparse opportunity, we believe that the virtues of a bottom-up process build portfolios of durable credits at attractive yields that can prevail in economic uncertainty and benefit our clients’ performance journey.


1 Our valuation framework is a purely quantitative screen for bonds that may offer excess return potential, primarily from mean reversion in spreads. When the potential excess return is above a specific hurdle rate, we label them “Buys” (others are “Holds” or “Sells”). These ratings are category names, not recommendations, as the valuation framework includes no credit research, a vital second step.
2Obligations such as bonds, notes, loans, leases, and other forms of indebtedness, except for cash and cash equivalents, issued by obligors other than the U.S. Government and its agencies, totaled at the level of the ultimate obligor or guarantor of the Obligation. Durable means the ability to withstand a wide variety of economic conditions.
Totals may not sum due to rounding.
The securities do not represent all of the securities purchased, sold, or recommended for advisory clients and you should not assume that investments in the securities were or will be profitable.
Issuers with credit ratings of AA or better are considered to be of high credit quality, with little risk of issuer failure. Issuers with credit ratings of BBB or better are considered to be of good credit quality, with adequate capacity to meet financial commitments. Issuers with credit ratings below BBB are considered speculative in nature and are vulnerable to the possibility of issuer failure or business interruption.
Purchase and sale information provided should not be considered as a recommendation to purchase or sell a particular security and that there is no assurance, as of the date of publication, that the securities purchased remain in a portfolio or that securities sold have not been repurchased.
Opinions, forecasts, and discussions about investment strategies are as of the date of this commentary and are subject to change without notice. References to specific securities, asset classes, and financial markets are not intended to be and should not be interpreted as recommendations.
Definitions
Bloomberg US Aggregate Bond Index is a market value-weighted index that tracks the daily price, coupon, pay-downs, and total return performance of fixed-rate, publicly placed, dollar denominated, and non-convertible investment grade debt issues with at least $300 million paramount outstanding and with at least one year to final maturity The index is not available for direct investment.
Duration is a measure of the portfolio’s return sensitivity to changes in interest rates.
An index is not available for direct investment
“Bloomberg®” and the Bloomberg indexes are service marks of Bloomberg Finance L.P. and its affiliates, including Bloomberg Index Services Limited (“BISL”), the administrator of the indexes (collectively, “Bloomberg”) and have been licensed for use for certain purposes by Brown Brothers Harriman & Co (BBH). Bloomberg is not affiliated with BBH, and Bloomberg does not approve, endorse, review, or recommend the Strategy. Bloomberg does not guarantee the timeliness, accurateness, or completeness of any data or information relating to the Strategy.
Risks
Investors should be able to withstand short-term fluctuations in fixed income markets in return for potentially higher returns over the long term. The value of portfolios changes every day and can be affected by changes in interest rates, general market conditions, and other political, social, and economic developments.
Asset-Backed Securities (“ABS”) are subject to risks due to defaults by the borrowers; failure of the issuer or servicer to perform; the variability in cash flows due to amortization or acceleration features; changes in interest rates which may influence the prepayments of the underlying securities; misrepresentation of asset quality, value or inadequate controls over disbursements and receipts; and the ABS being structured in ways that give certain investors less credit risk protection than others. Below investment grade bonds, commonly known as junk bonds, are subject to a high level of credit and market risks.
SASB lacks the diversification of a transaction backed by multiple loans since performance is concentrated in one commercial property. SASBs may be less liquid in the secondary market than loans backed by multiple commercial properties.
The Strategy invests in derivative instruments, investments whose values depend on the performance of the underlying security, assets, interest rate, index or currency and entail potentially higher volatility and risk of loss compared to traditional bond investments.
Foreign investing involves special risks including currency risk, increased volatility, political risks, and differences in auditing and other financial standards. Prices of emerging market securities can be significantly more volatile than the prices of securities in developed countries, and currency risk and political risks are accentuated in emerging markets.
The Strategy may engage in certain investment activities that involve the use of leverage, which may magnify losses.
A significant investment of assets in one or more sectors, industries, securities and/or durations may increase its vulnerability to any single economic, political, or regulatory developments, which will have a greater impact on returns. Illiquid investments subject the investor to the risk that she may not be able to sell the investments when desired or at favorable prices.
Portfolio Characteristics are of the Representative Account. The Representative Account is managed with the same investment objectives and employs substantially the same investment philosophy and processes as the Strategy.
One basis point or bp is 1/100th of a percent (0.01% or 0.0001).
Brown Brothers Harriman Investment Management (“IM”), a division of Brown Brothers Harriman & Co (“BBH”), claims compliance with the Global Investment Per¬formance Standards (GIPS®). GIPS® is a registered trademark of CFA Institute. CFA Institute does not endorse or promote this organization, nor does it warrant the accuracy or quality of the content contained herein.
To receive additional information regarding IM, including a GIPS Composite Report for the strategy, contact John W. Ackler at 212 493-8247 or via email at john.ackler@bbh.com.
Gross of fee performance results for this composite do not reflect the deduction of investment advisory fees. Actual returns will be reduced by such fees. Net of fees performance results reflects the deduction of the maximum investment advisory fees. Returns include all dividends and interest, other income, realized and unrealized gain, are net of all brokerage commissions, execution costs, and without provision for federal or state income taxes. Results will vary among client accounts. Perfor¬mance calculated in U.S. dollars.
The objective of our Core Plus Fixed Income Strategy is to deliver excellent after-tax returns in excess of industry benchmarks through market cycles. The Representative Account is managed with the same investment objectives and employs substantially the same investment philosophy and processes as the strategy. The Composite included all fully discretionary, fee-paying core fixed income accounts over $10 million that are managed to a duration of approximately 4.5 years and are invested in a broad range of taxable bonds. Accounts that subsequently fall below $9.25 million are excluded from the Composite.
Brown Brothers Harriman & Co. (“BBH”) may be used to reference the company as a whole and/or its various subsidiaries generally. This material and any products or services may be issued or provided in multiple jurisdictions by duly authorized and regulated subsidiaries. This material is for general information and reference purposes only and does not constitute legal, tax or investment advice and is not intended as an offer to sell, or a solicitation to buy securities, services or investment products. Any reference to tax matters is not intended to be used, and may not be used, for purposes of avoiding penalties under the U.S. Internal Revenue Code, or other applicable tax regimes, or for promotion, marketing or recommendation to third parties. All information has been obtained from sources believed to be reliable, but accuracy is not guaranteed, and reliance should not be placed on the information presented. This material may not be reproduced, copied or transmitted, or any of the content disclosed to third parties, without the permission of BBH. All trademarks and service marks included are the property of BBH or their respective owners. © Brown Brothers Harriman & Co. 2025. All rights reserved.
Not FDIC Insured No Bank Guarantee May Lose Money
IM-17501-2025-10-30 Exp. Date 1/31/2026