

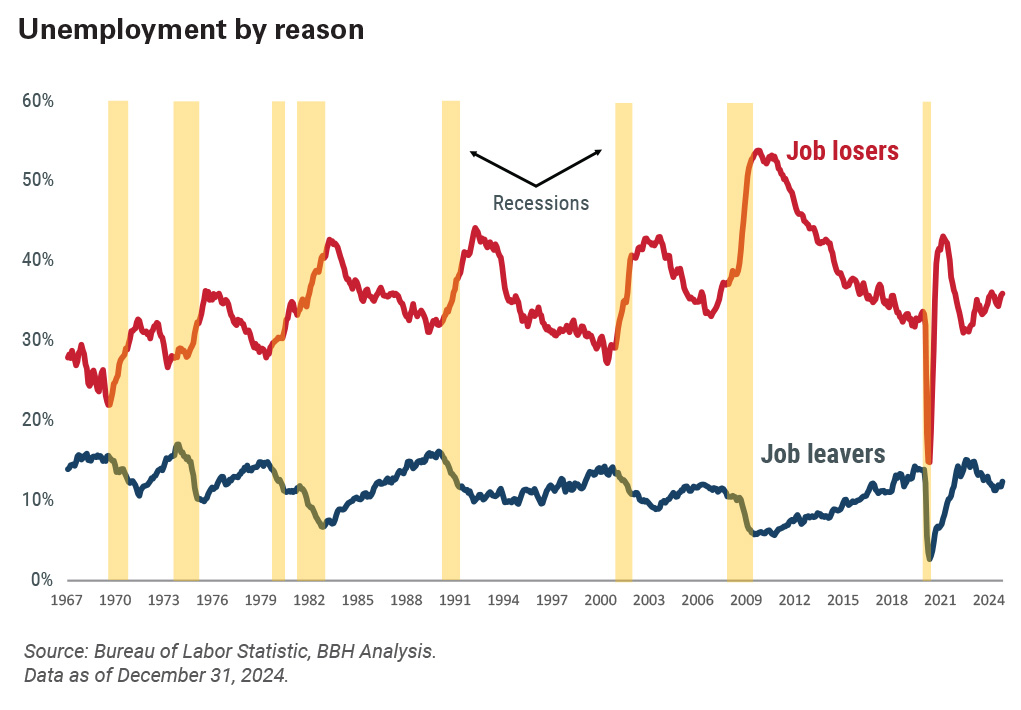
Chart showing the negative correlation between the percentage of job leavers and job losers from 1967 to 2024. As of December 31, 2024, job losers made up 36% of the unemployment force, and job leavers made up 12%.
To paraphrase the great American philosopher Mark Twain, the rumors of the death of this economic cycle have been greatly exaggerated. Close readers will recall that most economists (including your faithful correspondent) expected a modest recession to materialize in 2023, and with good reason. The economic sugar high of pandemic-era fiscal stimulus had come to an end; the yield curve inverted, with the spread between two- and 10-year yields widening out to over 100 basis points (bps); and the index of Leading Economic Indicators (LEI) was flashing red.1 Despite these time-tested indications of economic stress, the economy didn’t get the memo. Real gross domestic product (GDP) grew 3.2% in 2023, and likely ended 2024 at a similar pace.
Economists got it wrong, but what went right? Simply put, people keep spending money, and personal consumption remains the primary engine of economic activity.
As we turn the calendar page, the U.S. economy starts 2025 on a strong note, yet economic storm clouds linger on the horizon. This tailwind of personal spending and household financial health may begin to wane, just as some policies of the Trump administration may introduce more economic uncertainty, and even reignite inflation. There may yet be bad economic weather ahead. Investors don’t need to open their umbrellas quite yet, but it would be a good idea to keep them within arm’s reach.
The state of household finanances
People spend money out of a sense of economic well-being and job security, which is why the labor market is so important to spending and sentiment. Jobs and paychecks create not only the ability but also the psychological willingness to spend money. The labor market is healthy: The U.S. economy added over 2.2 million jobs in 2024, ending the year with a strong gain of 256,000 jobs in December. Despite this tailwind, there are increasing signs that job growth will slow in 2025.
The graph nearby offers a snapshot of the composition of unemployment. For the past several months, the number of people who are unemployed because they got fired has been on the rise, while the number of people who quit their jobs voluntarily has declined. The negative correlation between these two trends is evident in the graph. Historically, an environment of more people being fired while fewer people are quitting has signaled rising economic stress. This doesn’t necessarily presage the end of this labor market boom, but it does imply slower wage growth and less job security going forward.
At the same time, household finances are showing incipient signs of stress. Consumer debt is at an all-time high of $18 trillion, while the personal savings rate, at 4.4%, is close to an all-time low. Household income and assets have risen at a faster pace than debt, so the economy is not threatened by a household debt bubble like the one that sparked the 2008 global financial crisis. There is, however, not much of a cushion in household finances.
Debt delinquencies are the clearest sign of household financial stress, and credit cards tend to lead the trend. Credit card delinquencies have been rising sharply since the middle of 2023, and over 11% of total outstanding balances are now more than 90 days overdue. This can be an early warning sign for future household stress, as a strapped borrower is likely to miss a few credit card payments before missing a mortgage or car payment. We will watch these developments closely throughout 2025 to see if credit card delinquencies continue to rise, and (more worrisomely) whether this stress leaks into other categories of consumer debt.
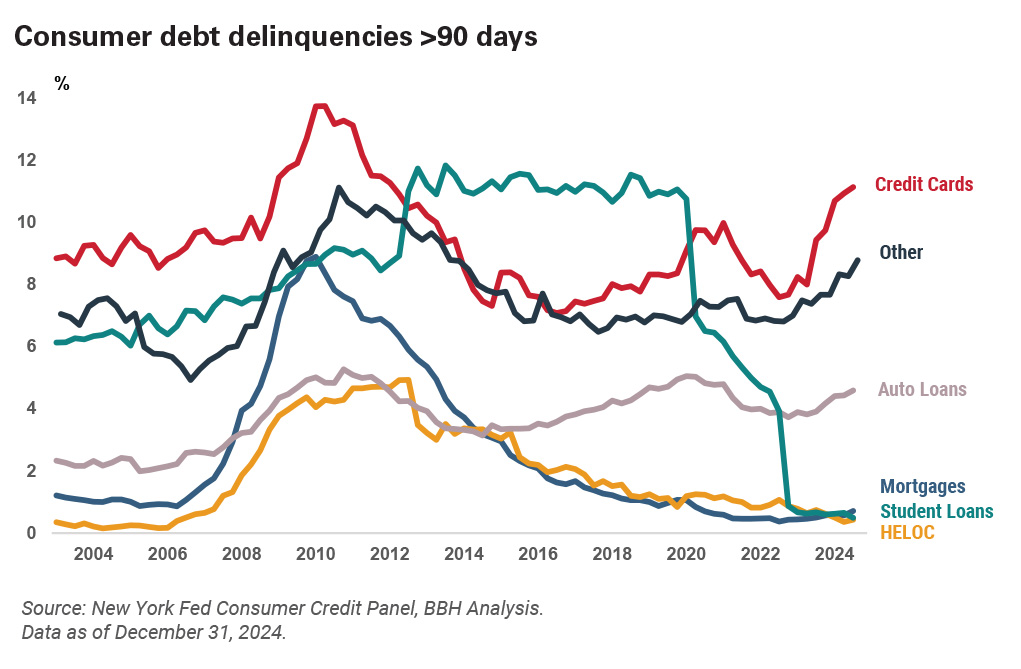
Graph showing the percent of loans more than 90 days delinquent. As of September 30, 2024, 11.3% of credit card loans were more than 90 days overdue.
The expansionary ripple effects of fiscal and monetary stimulus continued well beyond the end of the pandemic and lasted far longer than the extraordinary economic measures that accompanied the crisis. There is a more uncertain path forward, and we will learn in 2025 how much of a hangover might follow the fiscal party of the past few years.
Trump 2.0
The return of Donald J. Trump to the White House has introduced the same sort of policy and economic unpredictability that characterized his first administration. Every president has difficulty translating campaign promises into political reality, and our 47th president’s experience will be no different. President Trump will accomplish through executive orders those things he can enact on his own authority, but will need to manage razor-thin margins in congress to extend the 2017 Tax Cuts and Jobs Act (TCJA) and implement wide-ranging cost cuts in government spending, two priorities of his second term. He understands that he might lose these congressional majorities in the 2026 mid-term elections (as most presidents do), so the legislative calendar is tight.
We ultimately think that President Trump will succeed in extending the TCJA, perhaps with some modifications to mollify the few remaining fiscal hawks in Congress, and that he will furthermore succeed in rolling back some of the regulations imposed by the Biden administration. These would be supportive of economic activity and corporate earnings. However, two areas that might pose some unintended economic disruptions, and perhaps even push inflation higher, are trade and immigration policies.
Trade and tariffs
President Trump has made clear his intent to use tariffs more broadly than any administration since World War II. Up until the middle of the 20th century, tariffs were a consistent backdrop to the U.S. economy. From 1900 to 1945, the average tariff applied to dutiable goods was 39%, but then fell to 8% from 1946 to 2024. This reflects a prolonged opening of global markets and the establishment of multinational initiatives such as the General Agreement on Tariffs and Trade (GATT 1948), the World Trade Organization (WTO 1994), and the North American Free Trade Agreement (NAFTA 1994).
Every president since George Washington has used tariffs, most often to level a playing field deemed unfair by government subsidies, or (ironically) to protect nascent American industries. President Trump used tariffs tactically during his first administration, but now proposes a much broader application to encourage the growth of U.S. industry and manufacturing, raise revenues to help pay for an extension of the 2017 tax act (among other things), and to act as both carrot and stick to incentivize the behavior of trading partners. His proposals have varied over time, but center on a blanket tariff of 20%, plus a surcharge to bring tariffs on Chinese imports up to 60%. This would return the American tariff regime to a level not seen since the middle of the 20th century.
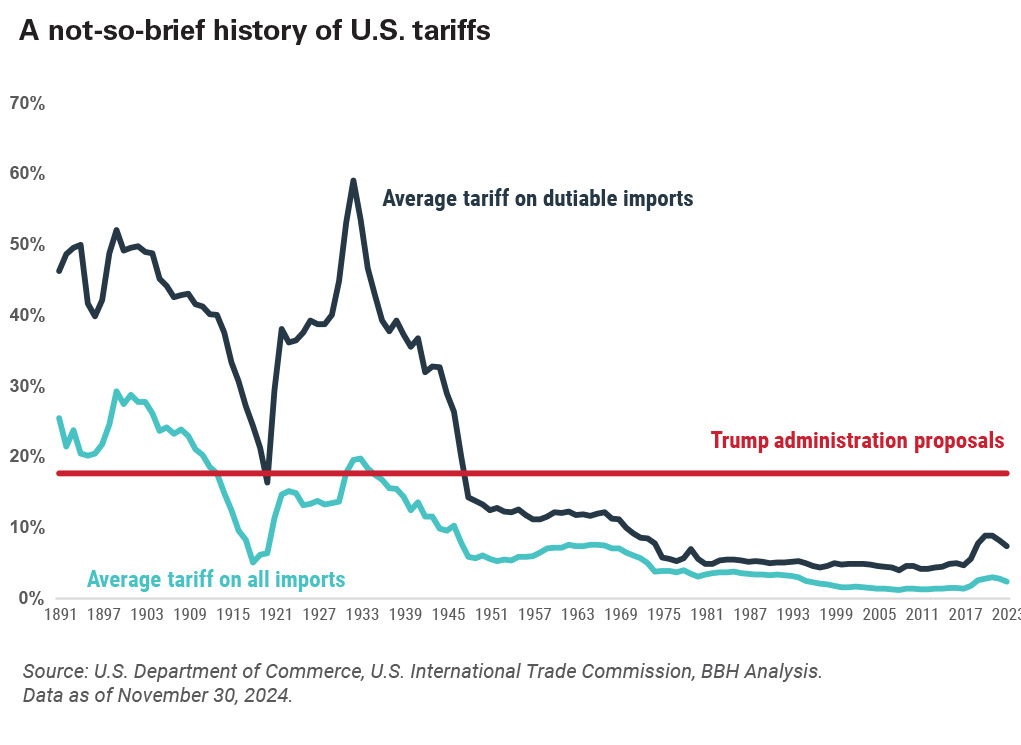
Graph displaying the average tariff on dutiable imports and all imports from 1991 through 2023 compared to the Trump administration's proposed tariffs. As of November 30, 2024, they are 7.4%, 2.4%, and 17.7%, respectively.
Tariff hikes would almost certainly prompt retaliatory tariffs on American exports, encourage cheating (for example, forged origins or sources), and ultimately cost consumers more money. The global network of manufacturing, outsourcing, and supply chains that defines the global economy has developed over an 80-year period of relatively low tariffs, and readjusting to a new economic reality of sharply higher tariffs would be disruptive and expensive in equal measure.
The revenue opportunities from broad tariffs are limited, at least in the grand scheme of the American economy. In 2023, the U.S. economy imported a little over $3.8 trillion, over one-third of which came from Mexico, China, and Canada. Applying blanket tariffs of 20% across this whole spectrum (and 60% for China) yields a hypothetical revenue of $944 billion, a figure that does not take into account cheating, substitutions, and reciprocal tariffs. In reality, receipts would likely be far lower than this simple calculation. Compare this figure to the overall U.S. fiscal deficit of $1.7 trillion and individual tax revenues of $2.2 trillion for the same period.
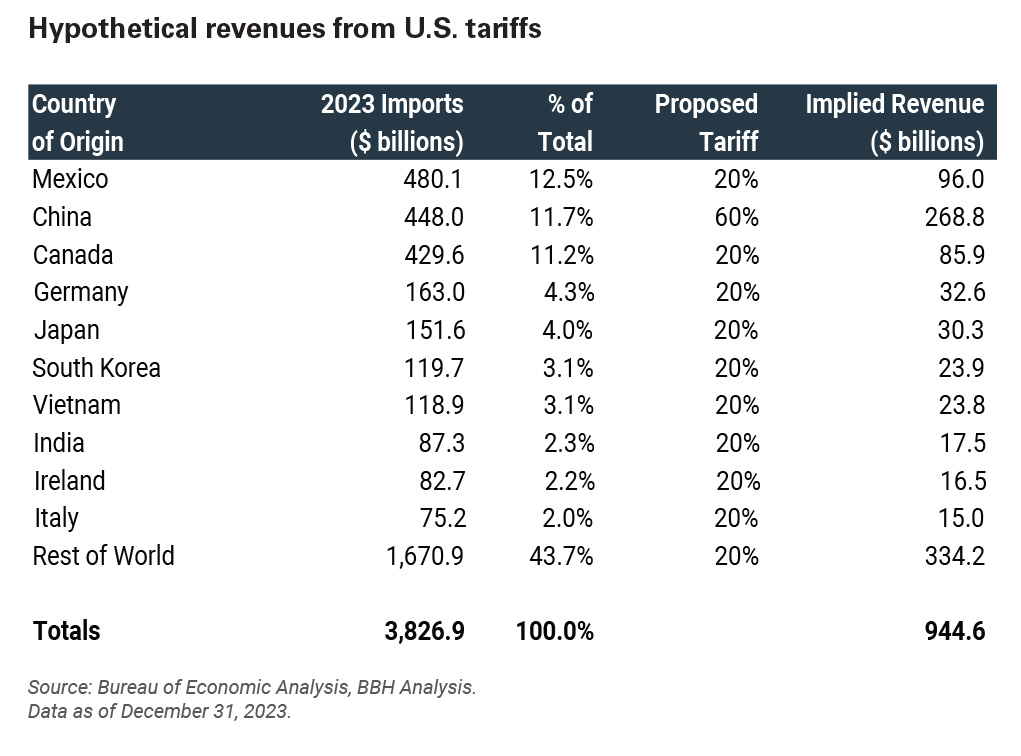
Table showing a hypothetical revenue of $944 billion in 2023 if a blanket tariff of 20% (60% for China) had been applied.
| Country of origin | 2023 Imports ($ billions) | % of total | Proposed tariff | Implied revenue ($ billions) |
| Mexico | 480.05 | 12.5% | 20% | 96.01 |
| China | 448.02 | 11.7% | 60% | 268.812 |
| Canada | 429.6 | 11.2% | 20% | 85.92 |
| Germany | 162.96 | 4.3% | 20% | 32.592 |
| Japan | 151.58 | 4.0% | 20% | 30.316 |
| South Korea | 119.72 | 3.1% | 20% | 23.944 |
| Vietnam | 118.94 | 3.1% | 20% | 23.788 |
| India | 87.28 | 2.3% | 20% | 17.456 |
| Ireland | 82.71 | 2.2% | 20% | 16.542 |
| Italy | 75.17 | 2.0% | 20% | 15.034 |
| Rest of World | 1670.9 | 43.7% | 20% | 334.18 |
| Totals | 3826.93 | 100.0% | 944.594 |
Furthermore, import tariffs are paid by American individuals and companies. The U.S. does not have taxation authority over foreign citizens and companies, and any attempt to create such an external taxation scheme would result in higher prices as importers incorporated these new tariffs into their cost structure. To be economically precise, higher tariffs don’t necessarily lead to higher inflation, as defined by a sustained upward trend in prices. The economic impact of tariffs looks more like a one-off price shock, but a shock that could ripple through a globally interconnected economy into higher prices across a wide range of goods and services.
The foundation of the post-World War II economic boom in the global economy was the opening of international markets and the rise of global trade. No one wins a trade war.
Immigration
Immigration has long been the most heated and controversial topic in politics: It is an emotional issue, as well as a legal, ethical, cultural, and social one. Immigration is also an economic issue, a fact that often gets lost in the political rhetoric. In the long run, an economy can only expand in line with the growth of its labor force, plus the productivity of that labor force. The U.S. has historically enjoyed a tailwind of population and labor force growth, but these trends are changing. From a peak of 3.75 children per woman in 1959, the U.S. fertility rate has now dropped to 1.62 – below the replacement rate. This implies that we will need to borrow from the population growth of other nations if we are to continue expanding our labor force and our economy. Hence the necessity of getting immigration right.
It is a rare point of agreement in Washington, D.C., that we’re not currently getting it right, although Democrats and Republicans disagree on how to address the issue. The first two points of Trump’s 20-point plan as a candidate were to “seal the border and stop the migrant invasion” and “carry out the largest deportation operation in American history.” His focus and stance are quite clear, and the appointments he has made signal his intent to carry through on these campaign promises.
It is frustratingly difficult to quantify the potential impact of this on the U.S. labor force, since by definition the focus is on undocumented people. Various estimates place the number of undocumented residents at 10 million to 12 million, with roughly 6 million to 7 million of these people in the labor force. Polls show widespread support for deporting people who commit crimes or otherwise abuse the system, but our concern is that broad deportations could disrupt the portion of these undocumented workers who are economically productive. Although undocumented, many of these workers do pay into the U.S. tax system. The Institute on Taxation and Economic Policy found that workers without Social Security numbers (a proxy for the lack of other documentation) paid $96.7 billion in federal, state, and local taxes in 2022, $25.7 billion in Social Security taxes, $6.4 billion in Medicare taxes, and $1.8 billion in unemployment insurance.
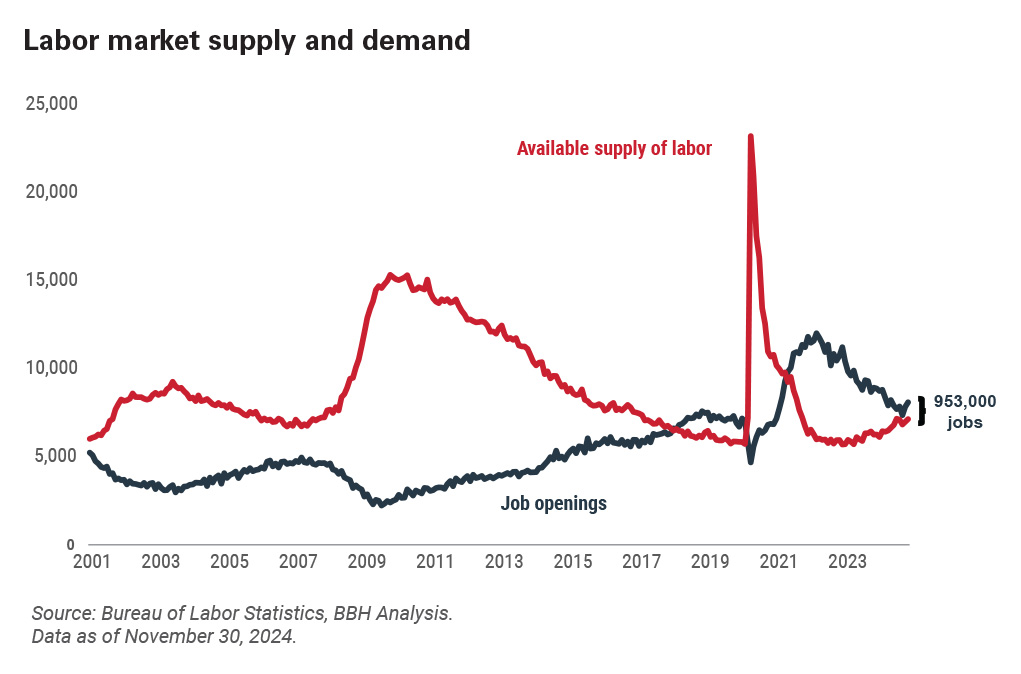
Chart showing the narrowing imbalance in the labor market between labor supply and labor demand (job openings). As of November 30, 2024, the gap was 953,000 jobs.
This potential forgone tax revenue isn’t the whole story. Of far larger import, mass deportations would widen the imbalance of labor market supply and demand, creating shortages of workers and driving up wages. The U.S. economy ended 2024 with close to a million more job openings than people available to fill them: Deportations threaten to amplify this imbalance. If this were to happen, the pain would fall primarily in agricultural and construction sectors, adding to food inflation and the cost of housing.
Monetary policy
This interplay between economic activity and inflation makes the task of the Federal Reserve that much more difficult. Recall that the Fed’s job consists of the pursuit of economic growth within a context of price stability. This so-called “twin mandate” has been easy to fulfill for most of the past 15 years, as inflation remained dormant (until a few years ago), allowing the Fed to keep interest rates lower for longer. The pandemic ended all that. The surge in inflation forced the Fed to hike interest rates aggressively, although various Fed governors claimed that inflation was “transitory” and that interest rates would fall once the inflationary transition ebbed. This narrative played out, as inflation (as measured by the Consumer Price Index [CPI]) peaked at 9.1% in June 2022 and dropped to 2.9% by December 2024.
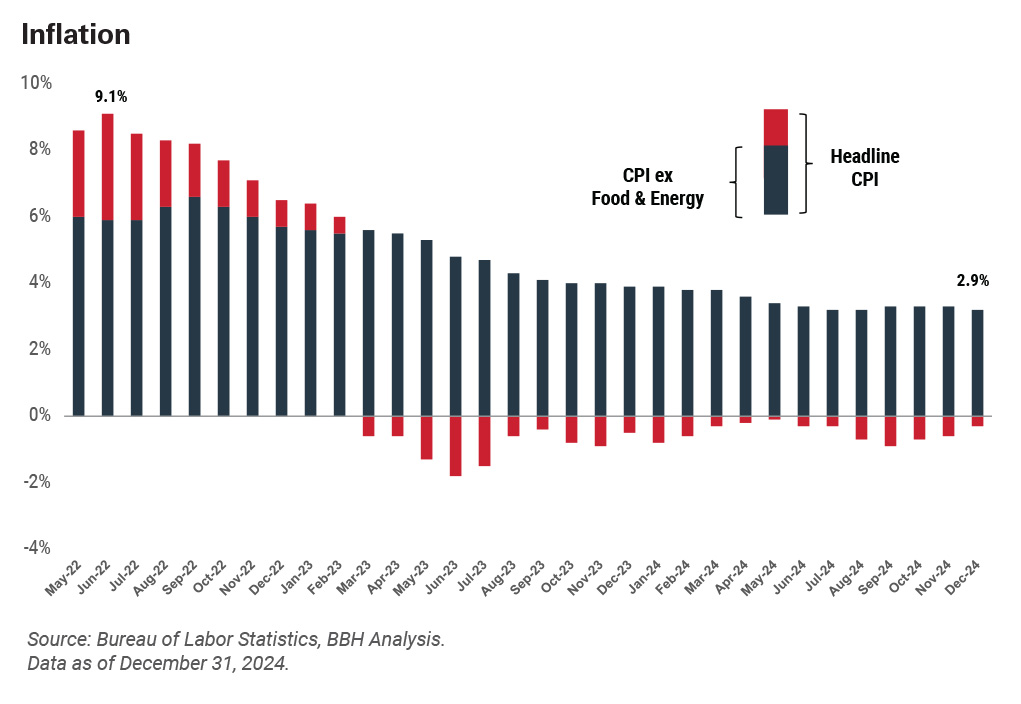
Chart tracking inflation (as measured by the CPI) from May 2022 through December 2024. It peaked at 9.1% in June 2022, and dropped to 2.9% by December 2024.
This narrative may be shifting once again. Inflation (and core inflation, in particular), has proven stickier than expected, and some of the policy initiatives outlined above may exert additional upward pressure on prices. The Fed’s job is no longer easy as it contends with persistent inflation and the possibility of slower economic growth. Interest rates might wind up higher for longer, or at least for longer than the market anticipated only a few months ago.
The fed funds futures market reflects this evolving narrative. On September 19, 2024, the Fed lowered interest rates by 50 bps, confident that “inflation is moving sustainably toward 2 percent.” At that time, the market anticipated that the Fed would lower interest rates an additional 175 bps to 200 bps by the end of 2025, as inflation continued to move closer to the Fed’s desired target. These expectations have narrowed sharply: As of late January, the futures market now expects only 25 bps to 50 bps of cuts by year-end, and some economists are whispering that the Fed could find itself in the position of needing to raise rates if inflation surges.
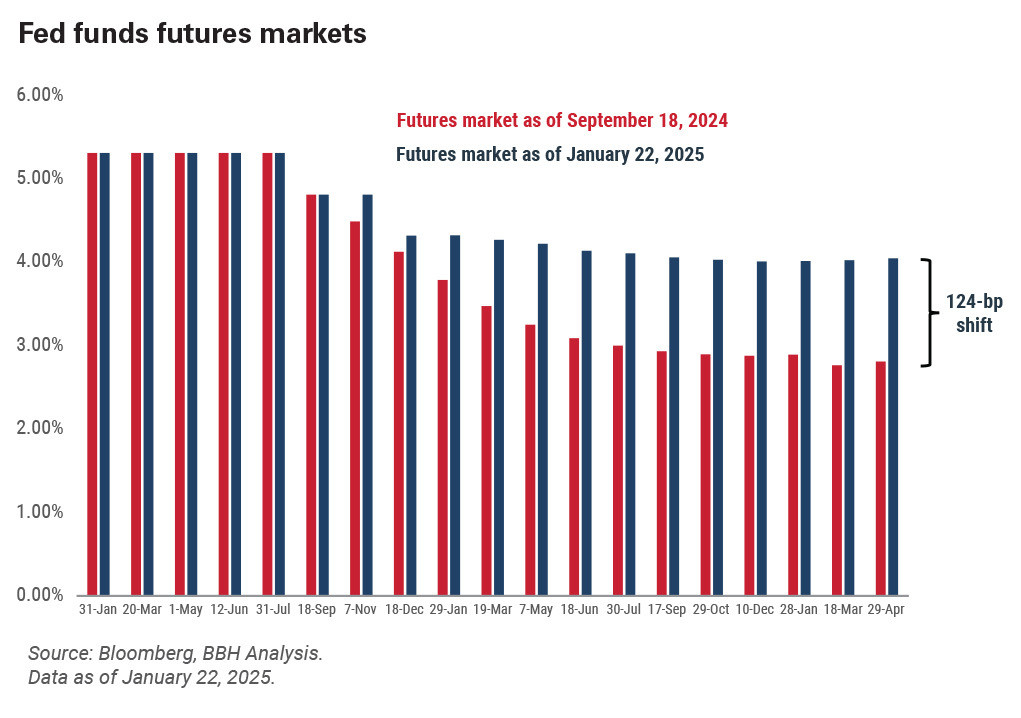
Chart showing the Fed funds futures markets as of September 18, 2024, and January 22, 2025. As of January 22, 2025, the market expects 25 basis points (bps) to 50 bps of cuts by year end - a 124-bp shift from 2024 predictions.
The most important Fed meeting of the year is likely to be March 19. We (and the Fed) will get two more months of labor market and inflation data before this meeting, as well as two months of seeing how successful the Trump administration is in turning proposals into policy.
The shifting narrative on monetary policy and interest rates is likely to be the biggest source of financial market volatility in 2025.
The market
The past two years have been good for the broad equity market. The S&P 500 rose 27% in 2023 (total return), followed by a 25% gain in 2024. Tempering this good news somewhat is the well-reported feature that these gains have been narrowly concentrated in a small handful of stocks. Indeed, over half of the market’s gains last year were due to the large technology stocks colloquially known as the Magnificent Seven.2
There is both good and bad news in this dynamic. The bad news is that narrowly led markets tend to be volatile: A bad day for Nvidia or Apple (who together account for over 13% of the capitalization-weighted S&P 500) is mathematically a bad day for the index. What goes up occasionally goes down.
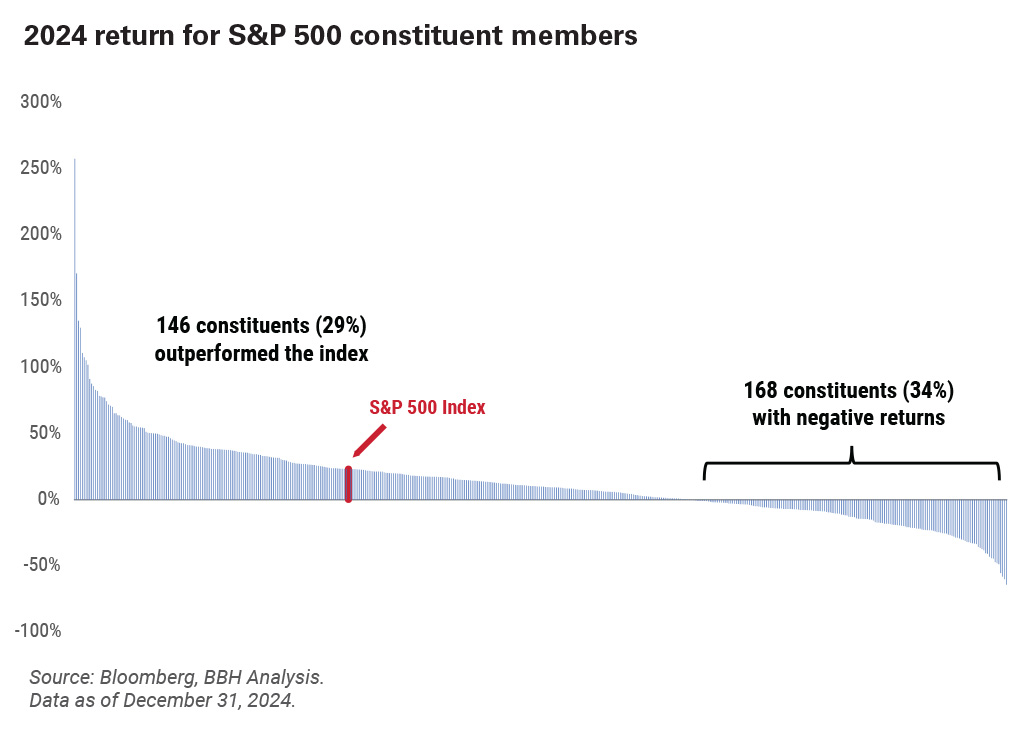
Chart displaying the 2024 return for S&P 500 constituent members. As of December 31, 2024, 29% outperformed the Index, while 34% had negative returns.
The good news for active investors is that the rally of the past few years has left plenty of companies behind: 168 stocks – over one-third of the index by name, not weight – posted negative returns in 2024. There was, in other words, a quiet bear market hidden in last year’s otherwise impressive returns. This is not to say that all these market laggards are good investments. It is to say that investment opportunities abound for the patient, value-focused investor willing to adopt a contrarian stance.
We also continue to find compelling opportunities in the broader equity market, including smaller- and mid-capitalization companies as well as equity markets outside the U.S. The large-cap S&P 500 has done so well for so long that it can be hard to justify the inclusion of other types of equity in a portfolio. This won’t always be the case: Reversion to the mean is a powerful force in financial markets, albeit a poor timing tool. Rebalancing is a critical ingredient to portfolio success, and we encourage investors to do so, particularly after such a strong rally in U.S. equities.
If the above economic scenario of stickier inflation unfolds, and interest rates remain higher for longer, so, too, will opportunities in fixed income remain attractive. For those investors with longer time horizons and the willingness to forgo liquidity, private debt in particular offers interesting opportunities, as private pools of capital fulfill financing needs that banks are increasingly reluctant to provide.
Conclusions
There is a difference between risk and uncertainty. Rolling a die is the classic example of risk-taking: Like flipping a coin or drawing a hand of cards, you don’t know what you’re going to get. You do, however, know the range of possible outcomes (one through six), along with the probability of each outcome (1/6 or 16.7%). Uncertainty is different, as if you don’t know how many faces are on the die, or what’s on them. Both the range of outcomes and the probability are unknowable.
Investors live with both risk and uncertainty. They are features, not bugs, of markets. The likelihood of economic and policy change in 2025 offers heightened uncertainty, which will likely translate into heightened price volatility. We believe that a focus on fundamental analysis and a deep appreciation for value are essential in any investment environment, and they are critically essential in this one.
Contact Us


1 Basis point (bp) is a unit that is equal to 1/100th of 1% and is used to denote the change in price or yield of a financial instrument.
2 The Magnificent Seven stocks are Alphabet, Amazon, Apple, Meta Platforms, Microsoft, NVIDIA, and Tesla.
References to specific securities, asset classes, and financial markets are for illustrative purposes only and are not intended to be and should not be interpreted as recommendations.
Brown Brothers Harriman & Co. (“BBH”) may be used to reference the company as a whole and/or its various subsidiaries generally. This material and any products or services may be issued or provided in multiple jurisdictions by duly authorized and regulated subsidiaries. This material is for general information and reference purposes only and does not constitute legal, tax or investment advice and is not intended as an offer to sell, or a solicitation to buy securities, services or investment products. Any reference to tax matters is not intended to be used, and may not be used, for purposes of avoiding penalties under the U.S. Internal Revenue Code, or other applicable tax regimes, or for promotion, marketing or recommendation to third parties. All information has been obtained from sources believed to be reliable, but accuracy is not guaranteed, and reliance should not be placed on the information presented. This material may not be reproduced, copied or transmitted, or any of the content disclosed to third parties, without the permission of BBH. All trademarks and service marks included are the property of BBH or their respective owners. © Brown Brothers Harriman & Co. 2025. All rights reserved. PB-08168-2025-01-14