The case against market timing

April 30, 2025
Chief Investment Officer Justin Reed discusses market timing. He explores its allure and pitfalls, stressing our belief that the adoption of a value-oriented, bottom-up investment approach, along with a long-term investment horizon and prudent rebalancing plan, is a far more compelling investment strategy.

There are only two types of people: those who can’t market time, and those who don’t know they can’t market time.” – Terry Smith (Fundsmith)


Heading into 2024, few could have predicted the remarkable resilience and continued dominance of a small handful of mega-cap technology stocks. After a volatile 2022 and rise of the Magnificent Seven (Mag 7)1 in 2023, many expected market leadership to broaden, yet concentration remained a defining characteristic of equity markets. In 2023, the S&P 500 returned 26.3%, while the Mag 7 returned 76%. In 2024, the S&P 500 returned 25% while the Mag 7 advanced 48.5%. Altogether, the S&P 500 gained over 25% for two consecutive years. Moreover, on an individual stock basis, only 29% of S&P 500 constituents outperformed the index (and 34% of stocks had negative returns), underscoring the dominance of a select few companies. Meanwhile, shifting interest rate expectations, geopolitical instability, and evolving macroeconomic conditions added further complexity.

As 2025 gets underway, we once again find ourselves facing an unpredictable market environment driven by President Trump’s tariff policy announced during “Liberation Day” (April 2, 2025), elevated U.S. equities valuation levels relative to their historical averages, an anticipated slowdown in global growth due to protectionism trade policies, and souring U.S. consumer sentiment.

Key questions loom: Will the Trump administration roll back tariffs to ease market volatility, given the S&P 500 has declined 9.8%2 since its February 19th peak? Will the U.S. dollar remain under pressure as investors seek safety in other currencies such as the Japanese Yen or Swiss Franc? Will the Federal Reserve continue to hold the fed funds target range steady, or will tariffs cause inflationary pressures to rebound and force a shift in monetary policy? Can market leadership rotate away from a handful of dominant companies, or will artificial intelligence (AI)- driven growth lead to a rotation back into the Mag 7? These uncertainties reinforce a fundamental truth: While it is tempting to make investment decisions based on predictions, history has shown that market cycles rarely unfold as expected.

While it is tempting to make investment decisions based on predictions, history has shown that market cycles rarely unfold as expected.”


The temptation to time the market – jumping in and out based on short-term moves – can be strong, especially in periods of uncertainty. However, history continues to show that successfully predicting market returns is exceptionally difficult, and missing just a handful of the market’s best days can significantly impact long-term returns.

We believe that market timing is not a reliable investment strategy. Instead, staying invested through market cycles and maintaining a disciplined long-term approach, staying diversified, and ensuring portfolios are resilient across different market conditions remains the best way to build wealth over time.

What is market timing?

We define market timing as the speculative strategy of making buy or sell decisions based on predictions of short-term market price movements. Importantly, market timing decisions are based on estimating the returns of the market (or corresponding index), such as U.S. large cap stocks, rather than a particular security.

Market timing strategies can involve several different approaches. One approach employs using nonfinancial indicators to predict market movements. For example, one may attempt to predict what may happen to U.S. equity markets if a given presidential candidate were to win an upcoming election. Such an investor may determine that the risk of an unfavorable candidate winning the election warrants staying out of the market until the election is resolved.

Another approach involves the use of technical indicators, such as historical stock prices. In this case, an investor might notice that the MSCI ACWI has generated positive returns for the past five years and may decide to wait for the “bubble” to burst.

Yet another common approach is timing based on historical market valuations. An investor utilizing this approach might make valuation comparisons across time or different markets. While keeping track of these data points can be helpful, attempting to base entry or exit decisions on them may be detrimental to long-term returns. There are too many other variables that influence market returns over the short to medium term, and it’s difficult for anyone to make accurate predictions on macro issues over a long period of time.

Time in the market vs. timing the market

Of course, investors would love to be able to time the market perfectly, investing at market bottoms and moving to cash at peaks. Unfortunately, such market timing is challenging for all investors, no matter how sophisticated. We adhere to the adage that “it is about the time in the market, not timing the market” that allows investors to best position themselves for strong long-term results. A long time horizon that benefits from the power of compounding is much more impactful, and generally more successful, than the mirage of market timing.

Instead of trying to time the market by monitoring broad market, economic, or political indicators, investors should utilize a bottom-up, fundamental approach with a long-term horizon to select high-quality individual securities trading at a discount to estimates of intrinsic value.3 Such an approach is the most reliable way to generate attractive long-term returns. In addition, investors are also well served by implementing a rebalancing strategy that optimizes the benefits of such actions without the potential tax consequences.

What is the allure of market timing?

Despite the abundance of evidence suggesting that market timing is a futile exercise, its allure persists. Why? One hypothesis is that this strategy is a response to the legitimate realities of investing as well as behavioral biases. Specifically, all investors can see how beneficial it would be if they could predict market movements and adjust a portfolio in advance of those movements. Doing so would allow one to dramatically outperform the gold standard of a buy-and-hold strategy over the long term.

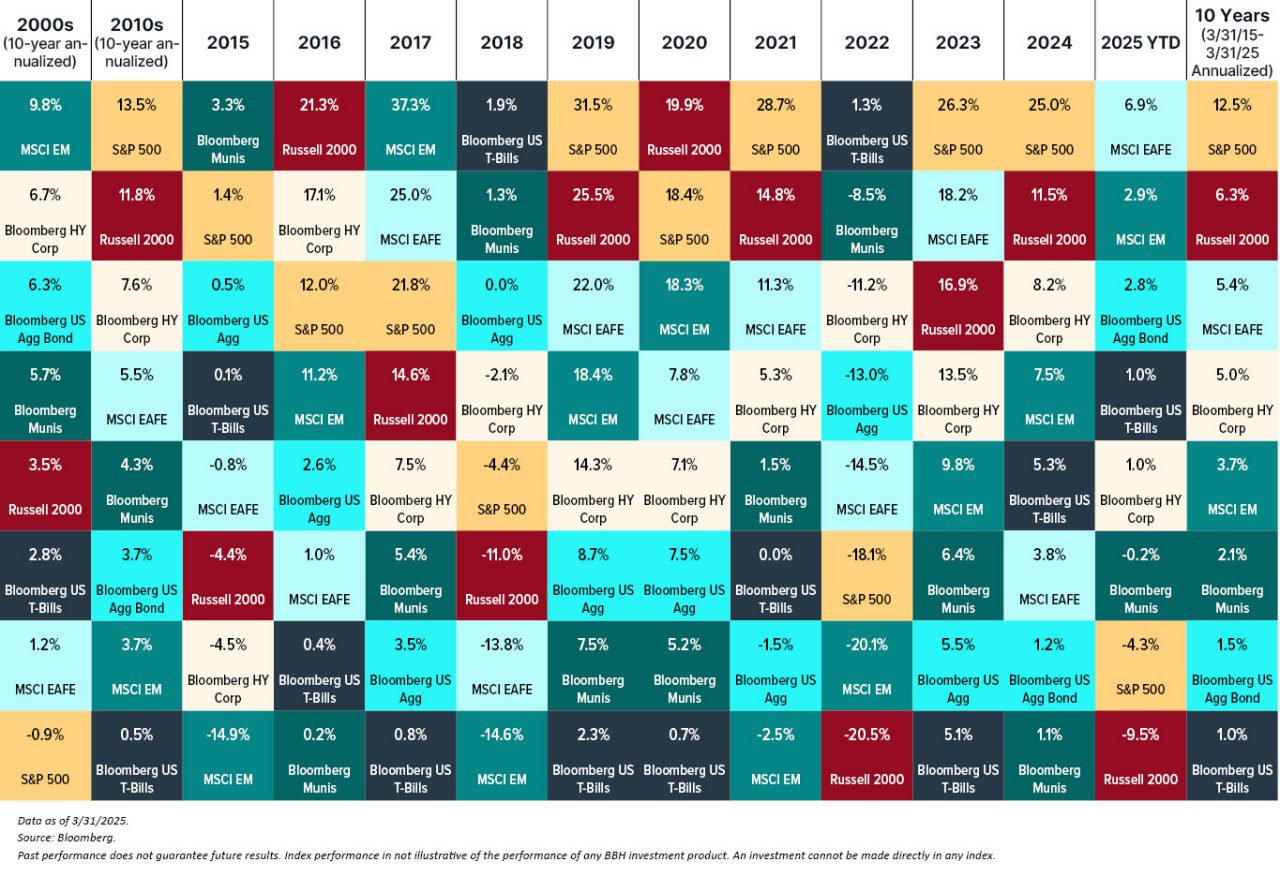
Looking at the following chart, the “all-knowing” investor would have moved out of developed international and into small-cap equities at the end of 2015, only to rotate into emerging market equities at the end of 2016. In theory, that investor would be able to generate returns at a level rarely attained.


Year-to-date 2025 asset class table of returns

2000s (10-year annualized): 9.8% MSCI EM; 6.7% Bloomberg HY Corp; 6.7% Bloomberg US Agg Bond; 5.7% Bloomberg Munis; 3.5% Russell 2000; 2.8% Bloomberg US T-Bills; 1.2% MSCI EAFE; -0.9% S&P 500.

2010s (10-year annualized): 13.5% S&P 500; 11.8% Russell 2000; 7.6% Bloomberg HY Corp; 5.5% MSCI EAFE; 4.3% Bloomberg Munis; 3.7% Bloomberg US Agg Bond; 3.7% MSCI EM; 0.5% Bloomberg US T-Bills.

2015: 3.3% Bloomberg Munis; 1.4% S&P 500; 0.5% Bloomberg US Agg; 0.1% Bloomberg US T-Bills; -0.8% MSCI EAFE; -4.4% Russell 2000; -4.5% Bloomberg HY Corp; -14.9% MSCI EM.

2016: 21.3% Russell 2000; 17.1% Bloomberg HY Corp; 12.0% S&P 500; 11.2% MSCI EM; 2.6% Bloomberg US Agg; 1.0% MSCI EAFE; 0.4% Bloomberg US T-Bills; 0.2% Bloomberg Munis.

2017: 37.3% MSCI EM; 25.0% MSCI EAFE; 21.8% S&P 500; 14.6% Russell 2000; 7.5% Bloomberg HY Corp; 5.4% Bloomberg Munis; 3.5% Bloomberg US Agg; 0.8% Bloomberg US T-Bills.

2018: 1.9% Bloomberg US T-Bills; 1.3% Bloomberg Munis; 0.0% Bloomberg US Agg; -2.1% Bloomberg HY Corp; -4.4% S&P 500; -11.0% Russell 2000; -13.8% MSCI EAFE; -14.6% MSCI EM.

2019: 31.5% S&P 500; 25.5% Russell 2000; 22.0% MSCI EAFE; 18.4% MSCI EM; 14.3% Bloomberg HY Corp; 8.7% Bloomberg US Agg; 7.5% Bloomberg Munis; 2.3% Bloomberg US T-Bills.

2020: 19.9% Russell 2000; 18.4% S&P 500; 18.3% MSCI EM; 7.8% MSCI EAFE; 7.1% Bloomberg HY Corp; 7.5% Bloomberg US Agg; 5.2% Bloomberg Munis; 0.7% Bloomberg US T-Bills.

2021: 28.7% S&P 500; 14.8% Russell 2000; 11.3% MSCI EAFE; 5.3% Bloomberg HY Corp; 1.5% Bloomberg Munis; 0.0% Bloomberg US T-Bills; -1.5% Bloomberg US Agg; -2.5% MSCI EM.

2022: 1.3% Bloomberg US T-Bills; -8.5% Bloomberg Munis; -11.2% Bloomberg HY Corp; -13.0% Bloomberg US Agg; -14.5% MSCI EAFE; -18.1% S&P 500; -20.1% MSCI EM; -20.5% Russell 2000.

2023: 26.3% S&P 500; 18.2% MSCI EAFE; 16.9% Russell 2000; 13.5% Bloomberg HY Corp; 9.8% MSCI EM; 6.4% Bloomberg Munis; 5.5% Bloomberg US Agg; 5.1% Bloomberg US T-Bills.

2024: 25.0% S&P 500; 11.5% Russell 2000; 8.2% Bloomberg HY Corp; 7.5% MSCI EM; 5.3% Bloomberg US T-Bills; 3.8% MSCI EAFE; 1.2% Bloomberg US Agg Bond; 1.1% Bloomberg Munis.

2025 YTD*: 6.9% MSCI EAFE; 2.9% MSCI EM; 2.8% Bloomberg US Agg Bond; 1.0% Bloomberg US T-Bills; 1.0% Bloomberg HY Corp; -0.2% Bloomberg Munis; -4.3% S&P 500; -9.5% Russell 2000.

10 Years (3/31/15 – 3/31/25 Annualized): 12.5% S&P 500; 6.3% Russell 2000; 5.4% MSCI EAFE; 5.0% Bloomberg HY Corp; 3.7% MSCI EM; 2.1% Bloomberg Munis; 1.5% Bloomberg US Agg Bond; 1.0% Bloomberg US T-Bills.

*Year-to-date is as of 3/31/2025

If we assume that from the beginning of 2009 to the end of 2024, at the end of each year an investor was able to rotate 100% of her portfolio out of the highest-returning asset class for that past year and rotate into the highest-returning asset class for the following year, she would have generated an annualized return of 22.8%, gross of fees and taxes, meaningfully outperforming the otherwise impressive 14.6% annualized return of U.S. large caps over the same period.

Despite this return potential, we rarely hear of people that have accumulated vast sums of wealth this way. As Peter Lynch said, “I can't recall ever once having seen the name of a market timer on Forbes’ annual list of the richest people in the world. If it were truly possible to predict corrections, you’d think somebody would have made billions by doing it.”

Several behavioral finance concepts also help to explain market timing’s allure. Hindsight bias is people’s tendency to remember their own predictions of the future to have been more accurate than they were in reality. This often leads people to conclude that they can more accurately predict future events than is warranted.

A behavioral bias that helps illuminate the allure of market timing is loss aversion, which is the tendency for people to weigh losses larger than gains when directly compared against each other.4 Loss aversion helps to explain why some investors, after concluding that the market is frothy from a valuation perspective, consider holding off on investing and waiting for a pullback. Investing and then watching your portfolio drop by 5% feels more painful than the corresponding happiness if the portfolio had gone up 5% over the same time period.

All else being equal, this bias can lead investors to market time by inappropriately keeping their portfolios in cash even though investing the capital is typically the more prudent decision to make.

Arguments against market timing

We believe that market timing is a fundamentally flawed approach for several reasons. First, the timing and magnitude of relative performance differentials (between asset classes) and market cycles are inherently unpredictable. In the short term, swings in investor sentiment and the related impact on valuation multiples often drive large swings in performance, but there are no durable or repeatable strategies to predict such changes.

For example, we know of no reliable way to have predicted that U.S. treasury bills would be the best-performing asset class in 2022 and one of few asset classes to generate a positive return, followed by two consecutive years of 25%+ gains for the S&P 500 in 2023 and 2024. How could anyone predict that the Fed would increase the fed funds rates by 425 basis points5 in 2022, leading to sell-off in global equities or longer-duration fixed income asset classes?

Longer term, larger market cycles are often driven by macroeconomic factors (e.g., interest rates and inflation ), “bubbles,” or financial crises, yet history has shown that forecasters are not adept at predicting these events either.

The following table shows the S&P 500’s 10 worst drawdowns and the surrounding events related to the decline. Categorizing the nature of the precipitating events for these drawdowns illustrates that, by their nature, the events are relatively unpredictable occurrences. A handful of investors always seem to avoid a single market drawdown, but the evidence shows that it is nearly impossible to do this consistently over time. After accounting for all market timing trades (successful and unsuccessful), the long-term track record of those who engage in market timing seems to be almost universally poor.


Market Peak
Date
Surrounding
Event(s)
Category Peak-to-Trough
S&P 500 Return
1/11/1973 Inflation Shock, OPEC Oil Embargo Inflation (44.8)
11/28/1980 Volcker/FOMC Interest Rate Hikes Monetary Policy (20.2)
10/5/1987 Black Monday Computer-Driven Selling, Investor Panic (31.3)
7/17/1998 Asian Currency Crisis, LTCM, Russia Default Financial Crisis (19.2)
9/1/2000 Tech and Telecom Bubble Bubble (47.4)
10/9/2007 Housing Bubble, Global Financial Crisis Bubble, Financial Crisis (54.8)
7/7/2011 Debt Ceiling, U.S. Credit Rating Downgrade Sovereign Downgrade (18.4)
3/4/2020 COVID-19 Global Pandemic Pandemic (28.4)
1/2/2022 FOMC Interest Rate Hikes/Inflation Monetary Policy (23.9)
2/19/2025 Tariffs Policy uncertainty (18.9)6
Data as of 4/28/2025.
Past performance does not guarantee future results.
Source: Bloomberg and BBH Analysis.

Even if we assume that an investor can predict events that will lead to market declines, he must also predict the correct time to buy and sell. Investors who predicted the tech bubble in the late 1990s or the housing bubble in 2005-06 still had to decide when to sell.

In hindsight, the tech bubble was well underway in fourth quarter 1999 (the Nasdaq was up 48%) but continued to climb another 84% before peaking in March 2000. Investors that were smart enough to predict the bubble then had to hold on until it burst. Similarly, the housing bubble was in full swing by 2005; however, prices did not crack until early 2007, and the stock market did not peak until October 2007. The market then lost 15% but did not sell off in earnest until the Lehman Brothers bankruptcy almost a year later in September 2008. To be successful, investors need to time their trades well, but then also have the temperament to hold on while the market marches higher.

Additionally, investors who are so lucky as to have sold prior to a market peak still need to decide when to buy back into the market. There are likely many more investors that sold at the right time than those that sold and reinvested appropriately. While investors are busy taking a victory lap for calling the peak correctly, the market can bottom and come roaring back quicker than expected.

The 2022 market environment is the perfect example of this. On October 12, 2022, the S&P 500 bottomed; however, it rallied almost 14% over the next six weeks. The market continued to recover and regained its prior high by the end of 2023, roughly one year after its prior peak.

While investors are busy taking a victory lap for calling the peak correctly, the market can bottom and come roaring back quicker than expected.” 


Yet another reason to avoid market timing is that it causes the realization of unnecessary taxes and transaction costs. While this is more of a concern for taxable investors, even tax-exempt investors must be mindful of transaction costs, as trading in illiquid asset classes during volatile markets can lead to steady leakage from long-term returns. For taxable investors, the bar for market timing is even higher because paying taxes disrupts the process of compounding.

An overwhelming body of empirical evidence suggests that the overall odds of succeeding with a market timing strategy are low. Morningstar’s annual Mind the Gap study of investor returns, for example, found investors earned about 6.3% per year on the average dollar they invested in mutual funds and exchange-traded funds over the 10 years ending December 31, 2023. This was about 1.1 percentage points less than the total returns their fund investments generated over that span. This gap stems from poorly timed purchases and sales of fund shares, which cost investors nearly one-sixth the return they would have earned if they had simply bought and held.7

What can investors do?

Market timing, in its various forms, is clearly not a strategy that will maximize returns over the long term. So, how can investors better position their portfolios to generate strong long-term returns?

We believe that maximizing long-term returns starts with a thoughtful, consistently applied investment philosophy and that the following principles are foundational to achieving strong long-term results:

• A value-oriented, bottom-up approach emphasizing deep diligence

• A focus on capital preservation

• A disciplined and patient style of investing

• A long time horizon

This philosophy leads us to invest in managers who are concentrated and only invest in securities they know extremely well and where they have a differentiated perspective.

As a result, our active managers do not own the market (e.g., they are not “closet indexers” that closely track the index and charge active management fees), nor do they make investment decisions based on shorter-term broad market, economic, or political indicators. Instead, their portfolio reflects their conviction level in a limited number of individual securities, based on assessments of the discount each security is trading to an estimate of intrinsic value.

The BBH approach to the market

A central tenet of our investment approach at BBH is a long time horizon. We believe that we may be more successful investing on behalf of our clients by letting our investments compound in value over time and sticking to our intended asset allocation plan, as opposed to timing our investments into and out of markets.

The following chart measures the percent of rolling time periods that are positive or negative for the S&P 500. A longer investment horizon is associated with an increased probability of generating positive returns. Thus, investors should take some comfort that with an appropriate time horizon, the wind will be at their back.


Horizontal Bar Chart titled "Percentage of Positive Versus Negative S&P 500 Rolling Returns" between December 30, 1927 - March 31, 2025. Source: Bloomberg as of March 31, 2025. X axis: Percentage of Positive versus Negative S&P 500 Rolling Returns. Y axis: years. Number of Positive Period: 1 year, 16,749, 3 years, 18,643, 5 years, 18,532, 10 years, 19,452. Number of Negative Period: 1 year, 7,428, 3 years, 5,034, 5 years, 4,643, 10 years, 2,479.

In addition to a fundamental, bottom-up investment philosophy, we believe that a thoughtful approach to rebalancing helps to best position portfolios for long-term success. Rebalancing back to asset allocation targets, assuming that a client’s risk and return goals are unchanged, is an important exercise.

While rebalancing involves trading, it has a different purpose than market timing. The primary objective of rebalancing is to keep a portfolio aligned with the client’s desired risk tolerance, and our preferred method is to set thresholds around asset class targets and rebalance only when those have been breached.

Thoughtfully implementing this approach can eliminate the otherwise difficult and subjective challenge of figuring out when to rebalance and removes the temptation to make rebalancing a thinly veiled attempt at market timing.

In conclusion, we believe that the adoption of a value-oriented, bottom-up investment approach, along with a long-term investment horizon and a prudent rebalancing plan, is a far more compelling investment strategy than market timing.

If you would like to learn more, please reach out to a BBH relationship manager or a member of our Investment Research Group.


Up Next
Up Next

An Inside View of BBH’s Asset Allocation Process: How We Create Value for Clients

Co-Chief Investment Officer Suzanne Brenner explores how the various aspects of our asset allocation, portfolio construction, risk management, and manager selection processes work together to create value for clients.

1Magnificent Seven (Mag 7): Apple, Microsoft, Alphabet (Google), Amazon, Nvidia, Meta, and Tesla
2Performance is from 2/19/2025 to 4/28/2025
3Intrinsic value is an estimate of the present value of the cash that a business can generate over its remaining life.
4Daniel Kahneman and Amos Tversky.
5Basis point (bp) is a unit that is equal to 1/100th of 1% and is used to denote the change in price or yield of a financial instrument.
62025 peak-to-trough uses 4/8/2025 as trough.
7Morningstar. “Mind the Gap 2024.”

Investors should be able to withstand short-term fluctuations in the equity markets and fixed income markets in return for potentially higher returns over the long term. The value of portfolios changes every day and can be affected by changes in interest rates, general market conditions and other political, social and economic developments.

Investment Advisory Products and services:

NOT FDIC INSURED   NO BANK GUARANTEE    MAY LOSE VALUE

Brown Brothers Harriman & Co. (“BBH”) may be used as a generic term to reference the company as a whole and/or its various subsidiaries generally.  This material and any products or services may be issued or provided in multiple jurisdictions by duly authorized and regulated subsidiaries.  This material is for general information and reference purposes only and does not constitute legal, tax or investment advice and is not intended as an offer to sell, or a solicitation to buy securities, services or investment products.  All information has been obtained from sources believed to be reliable, but accuracy is not guaranteed, and reliance should not be placed on the information presented.  This material may not be reproduced, copied or transmitted, or any of the content disclosed to third parties, without the permission of BBH.  All trademarks and service marks included are the property of BBH or their respective owners. ©Brown Brothers Harriman & Co. 2023. All rights reserved. PB-08258-2025-02-10

As of June 15, 2022 Internet Explorer 11 is not supported by BBH.com.

Important Information for Non-U.S. Residents

You are required to read the following important information, which, in conjunction with the Terms and Conditions, governs your use of this website. Your use of this website and its contents constitute your acceptance of this information and those Terms and Conditions. If you do not agree with this information and the Terms and Conditions, you should immediately cease use of this website. The contents of this website have not been prepared for the benefit of investors outside of the United States. This website is not intended as a solicitation of the purchase or sale of any security or other financial instrument or any investment management services for any investor who resides in a jurisdiction other than the United States1. As a general matter, Brown Brothers Harriman & Co. and its subsidiaries (“BBH”) is not licensed or registered to solicit prospective investors and offer investment advisory services in jurisdictions outside of the United States. The information on this website is not intended to be distributed to, directed at or used by any person or entity in any jurisdiction or country where such distribution or use would be contrary to law or regulation. Persons in respect of whom such prohibitions apply must not access the website.  Under certain circumstances, BBH may provide services to investors located outside of the United States in accordance with applicable law. The conditions under which such services may be provided will be analyzed on a case-by-case basis by BBH. BBH will only accept investors from such jurisdictions or countries where it has made a determination that such an arrangement or relationship is permissible under the laws of that jurisdiction or country. The existence of this website is not intended to be a substitute for the type of analysis described above and is not intended as a solicitation of or recommendation to any prospective investor, including those located outside of the United States. Certain BBH products or services may not be available in certain jurisdictions. By choosing to access this website from any location other than the United States, you accept full responsibility for compliance with all local laws. The website contains content that has been obtained from sources that BBH believes to be reliable as of the date presented; however, BBH cannot guarantee the accuracy of such content, assure its completeness, or warrant that such information will not be changed. The content contained herein is current as of the date of issuance and is subject to change without notice. The website’s content does not constitute investment advice and should not be used as the basis for any investment decision. There is no guarantee that any investment objectives, expectations, targets described in this website or the  performance or profitability of any investment will be achieved. You understand that investing in securities and other financial instruments involves risks that may affect the value of the securities and may result in losses, including the potential loss of the principal invested, and you assume and are able to bear all such risks.  In no event shall BBH or any other affiliated party be liable for any direct, incidental, special, consequential, indirect, lost profits, loss of business or data, or punitive damages arising out of your use of this website. By clicking accept, you confirm that you accept  to the above Important Information along with Terms and Conditions.

 
1BBH sponsors UCITS Funds registered in Luxembourg, in certain jurisdictions. For information on those funds, please see bbhluxembourgfunds.com


captcha image

Type in the word seen on the picture

I am a current investor in another jurisdiction